Fig. 6.
Download original image
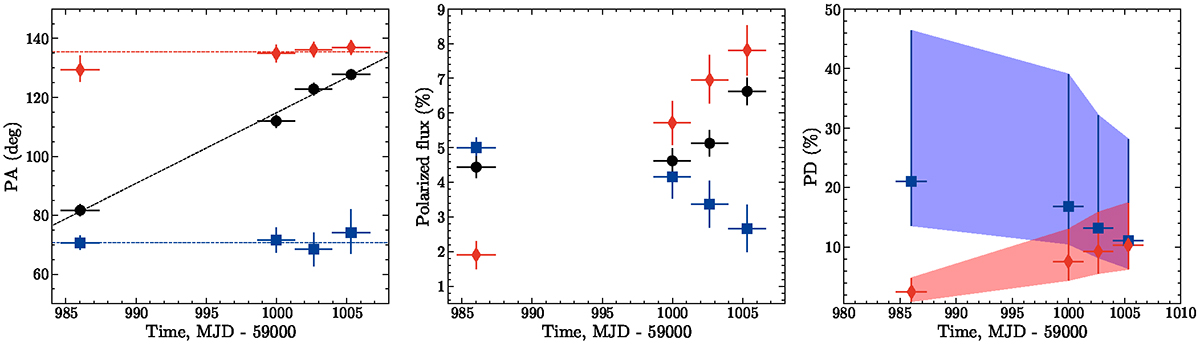
Pulse phase-averaged variations of PA, polarized flux, and PD over time. Left panel: Pulse phase-averaged PA variations over time, where black dots represent the total PA, red diamonds denote the PA of the variable component, and blue squares indicate the PA of the constant component. Middle and right panels: Polarized flux and PD variations over time, using the same markers as in the left panel, respectively.
Current usage metrics show cumulative count of Article Views (full-text article views including HTML views, PDF and ePub downloads, according to the available data) and Abstracts Views on Vision4Press platform.
Data correspond to usage on the plateform after 2015. The current usage metrics is available 48-96 hours after online publication and is updated daily on week days.
Initial download of the metrics may take a while.