Open Access
Fig. 8
Download original image
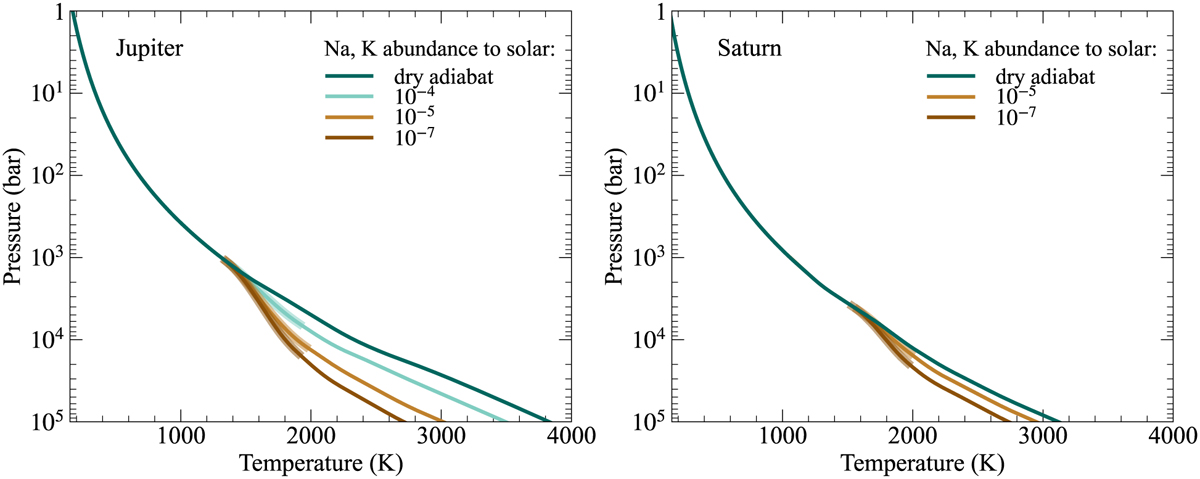
Temperature pressure profiles of Jupiter (left panel) and Saturn (right panel) for different K and Na abundances. The parts where radiative zones exist are indicated as the shaded regions. The adiabatic models are given as green curves.
Current usage metrics show cumulative count of Article Views (full-text article views including HTML views, PDF and ePub downloads, according to the available data) and Abstracts Views on Vision4Press platform.
Data correspond to usage on the plateform after 2015. The current usage metrics is available 48-96 hours after online publication and is updated daily on week days.
Initial download of the metrics may take a while.