Open Access
Fig. 5
Download original image
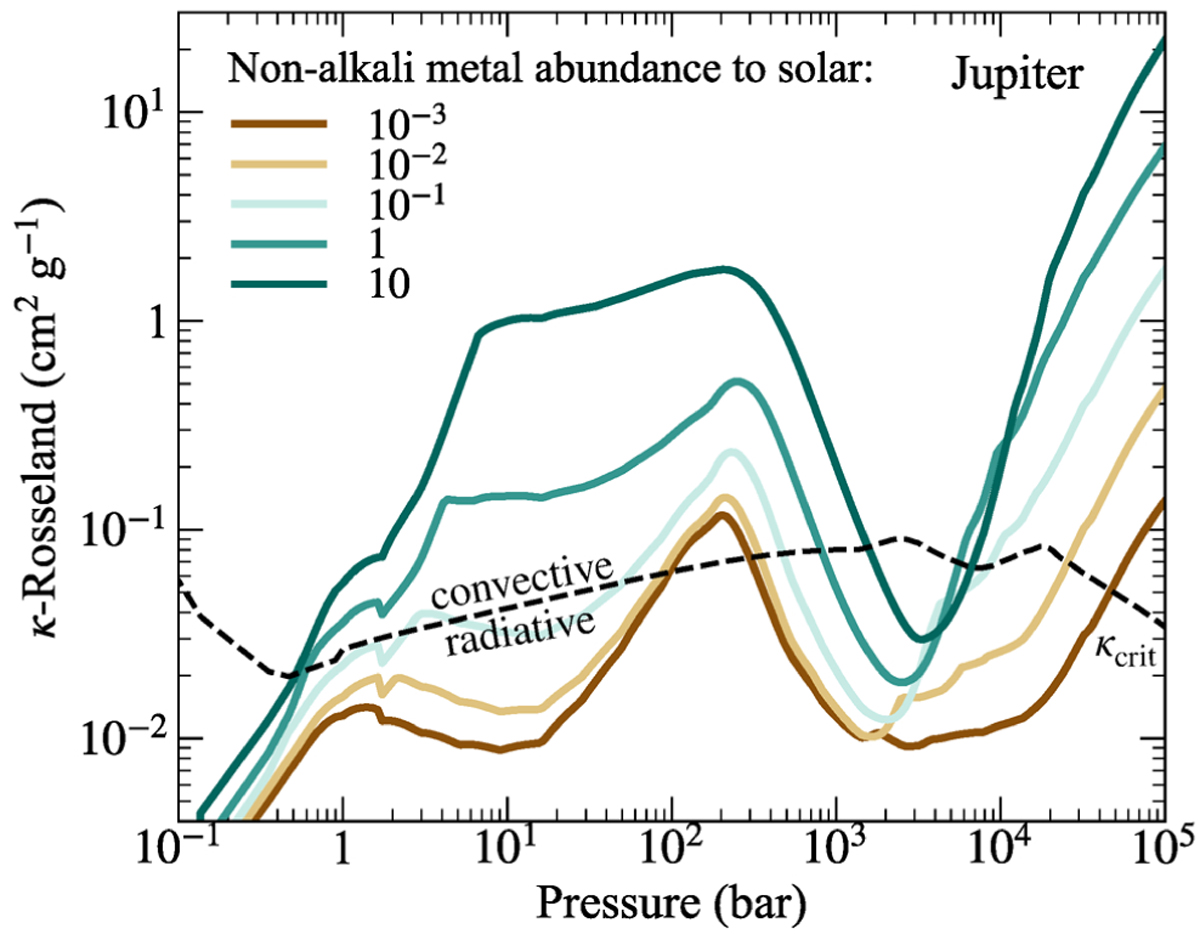
ĸR (solid coloured curves) as a function of pressure for atmospheres with varying heavy element abundances, but fixed Na and K abundances of 10−5 times solar. The opacities were calculated along a Jupiter profile. The dashed black curve corresponds to the critical opacity, ĸcrit.
Current usage metrics show cumulative count of Article Views (full-text article views including HTML views, PDF and ePub downloads, according to the available data) and Abstracts Views on Vision4Press platform.
Data correspond to usage on the plateform after 2015. The current usage metrics is available 48-96 hours after online publication and is updated daily on week days.
Initial download of the metrics may take a while.