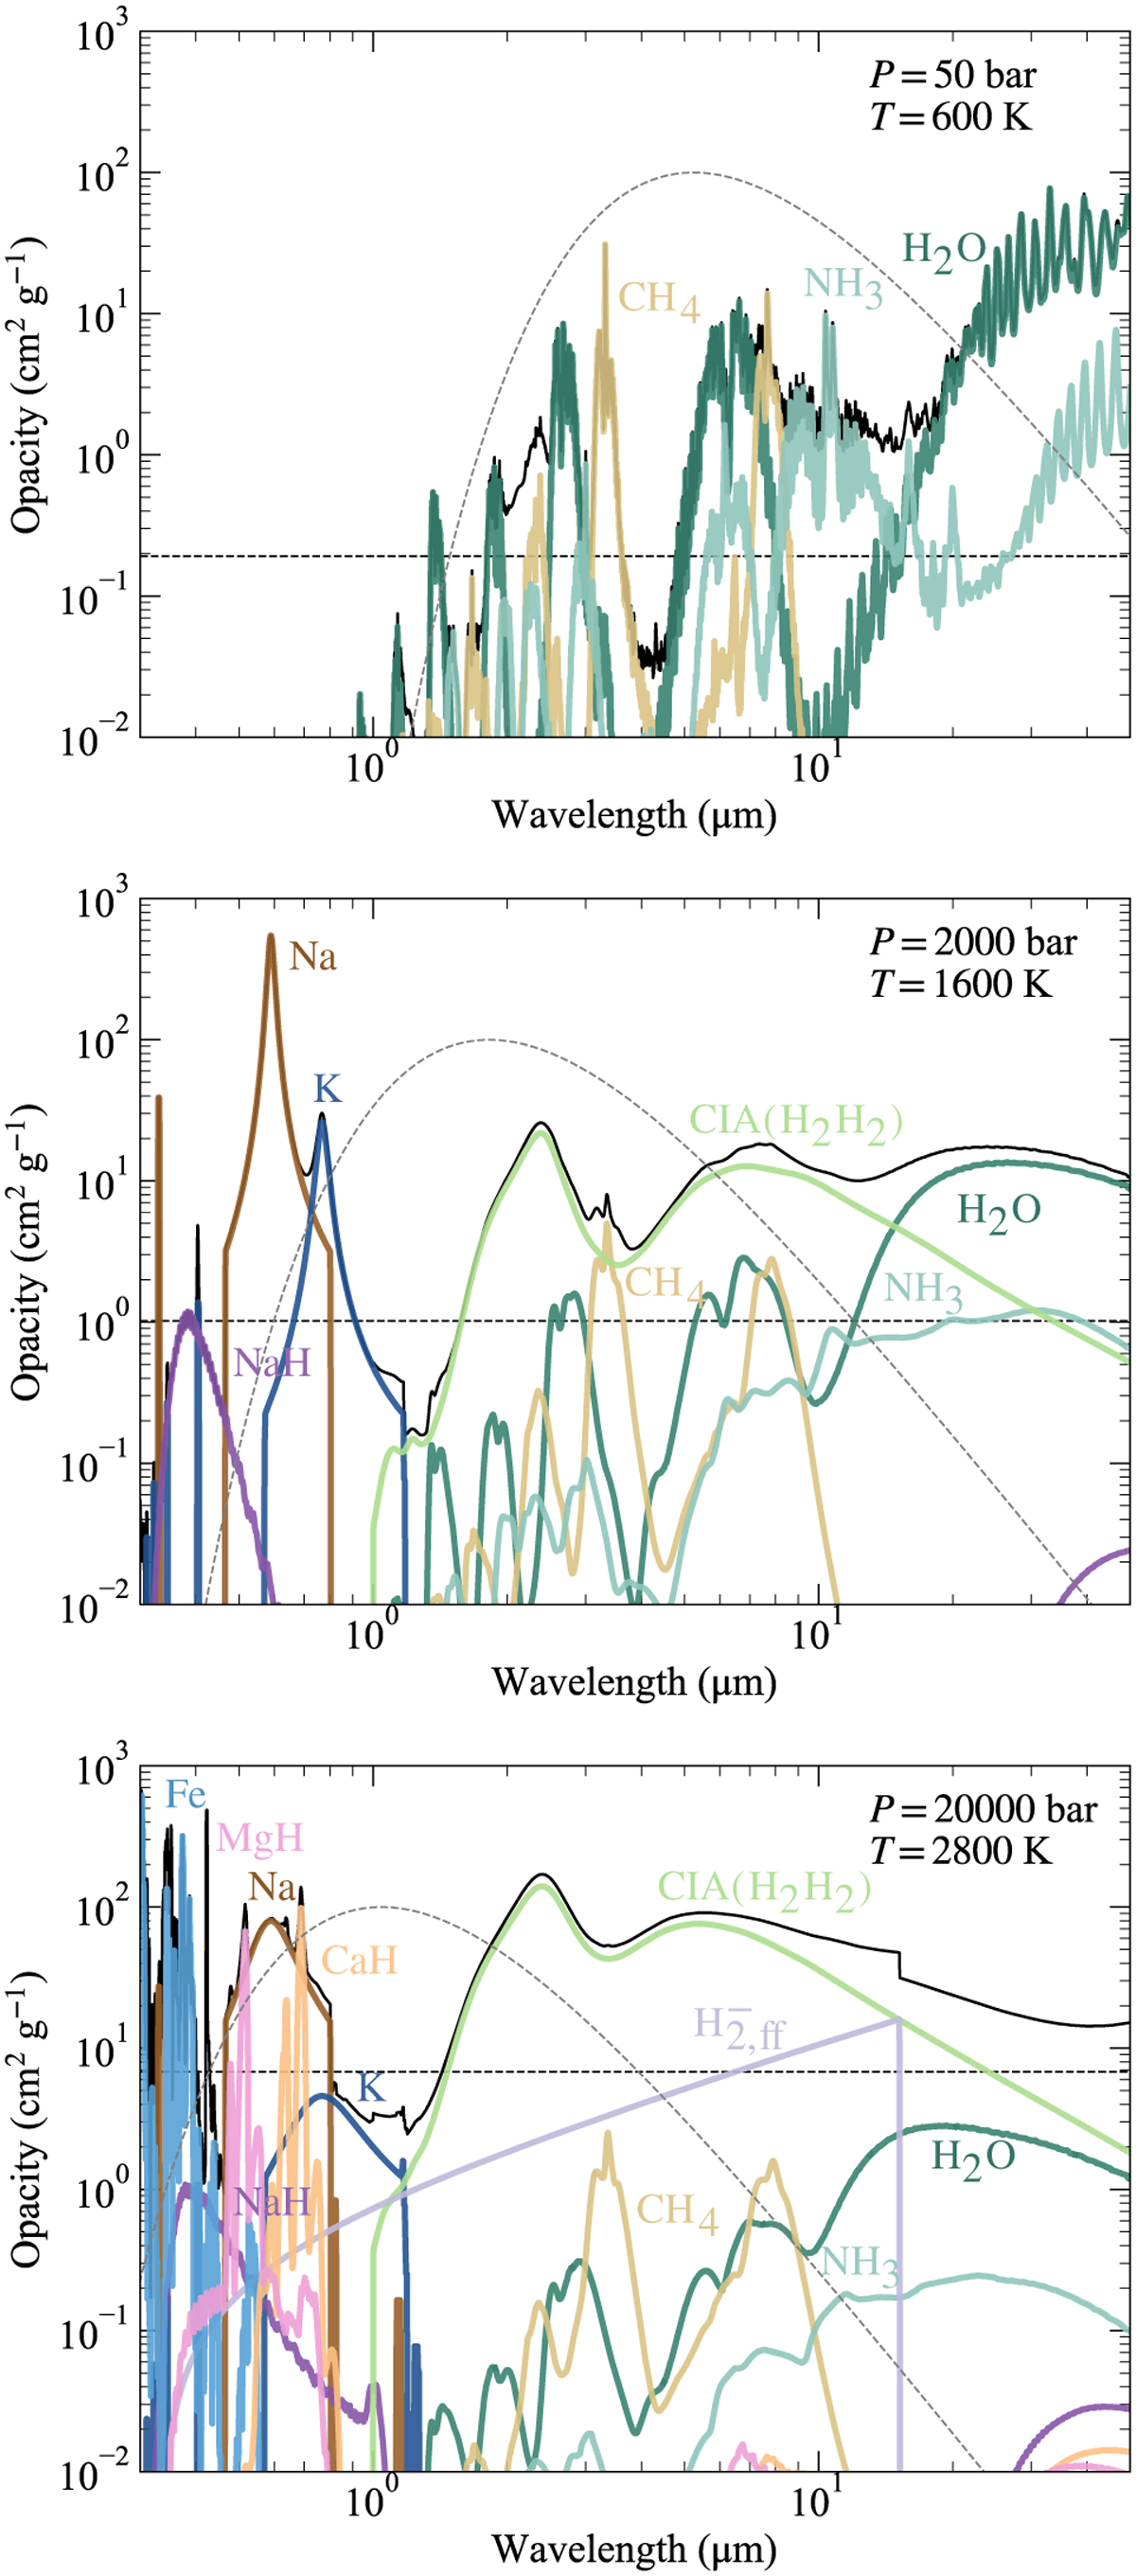
Fig. 3
Download original image
Opacities of Jupiter at different depths, assuming a solar composition in heavy elements. The total opacity of the layer is given in black, and the opacities of individual species are given as coloured curves. The Rosseland-mean opacity, ĸR, of the layer is shown as the dashed black line and the Planck function at the relevant temperature is given as the dashed grey curve.
Current usage metrics show cumulative count of Article Views (full-text article views including HTML views, PDF and ePub downloads, according to the available data) and Abstracts Views on Vision4Press platform.
Data correspond to usage on the plateform after 2015. The current usage metrics is available 48-96 hours after online publication and is updated daily on week days.
Initial download of the metrics may take a while.