Open Access
Fig. 9
Download original image
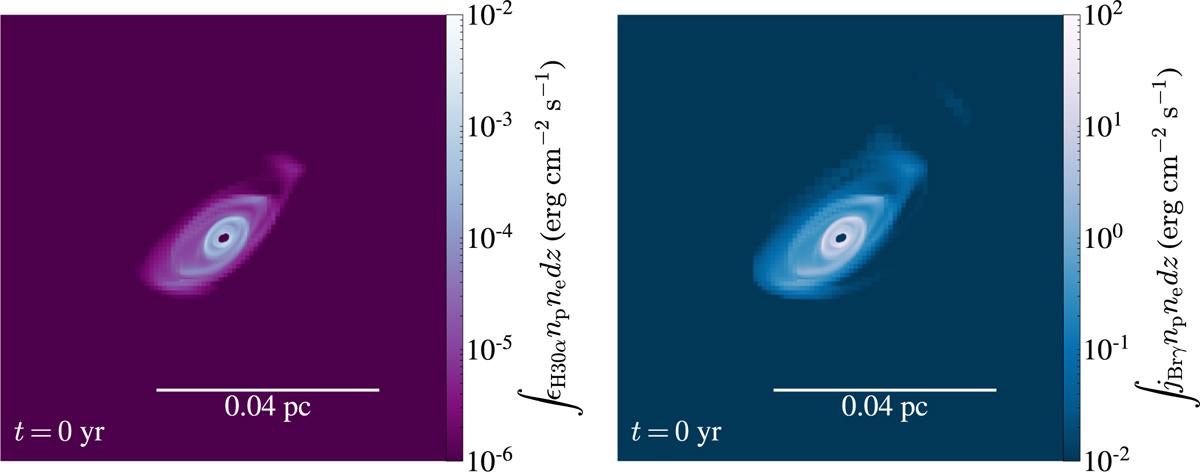
Line-of-sight integrated maps of the emission of the H30α and Brγ recombination lines shown on the left- and right-hand side panels. The maps correspond to the inner 2″× 2″ of the model WR_f1.
Current usage metrics show cumulative count of Article Views (full-text article views including HTML views, PDF and ePub downloads, according to the available data) and Abstracts Views on Vision4Press platform.
Data correspond to usage on the plateform after 2015. The current usage metrics is available 48-96 hours after online publication and is updated daily on week days.
Initial download of the metrics may take a while.