Open Access
Fig. 10
Download original image
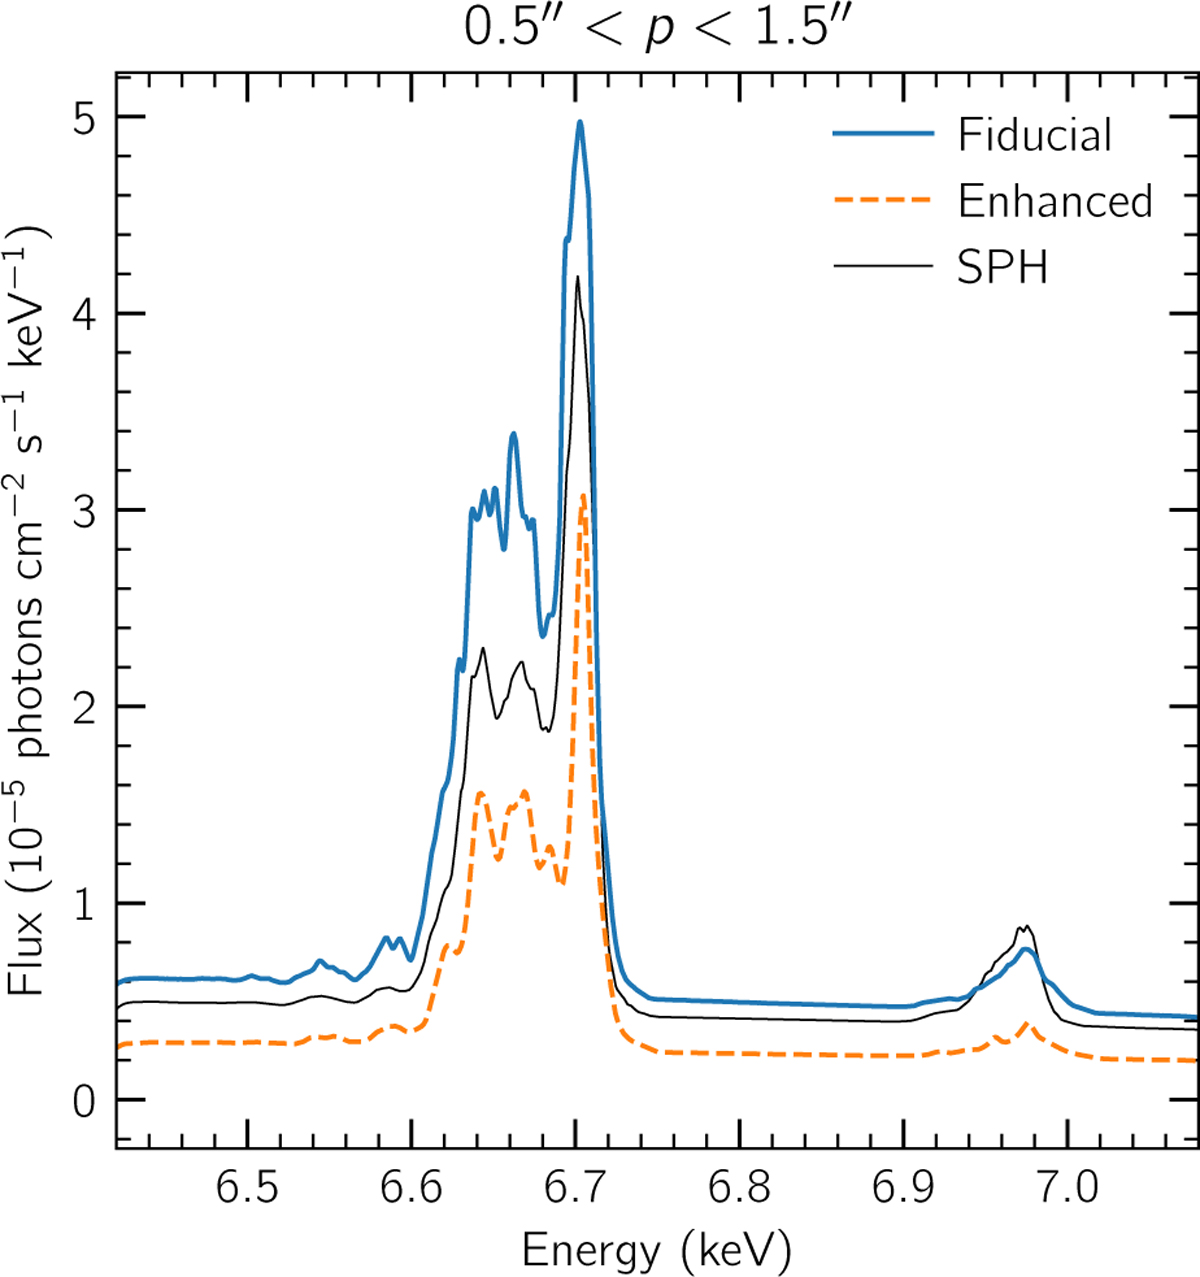
Synthetic X-ray spectra computed from the numerical models in an annulus of 0.5″ < p < 1.5″. The models WR_f07 and WR_f1 are shown in solid orange and dashed blue lines, respectively. Additionally, the thin solid black line corresponds to the results from the SPH model (Balakrishnan et al. 2024b).
Current usage metrics show cumulative count of Article Views (full-text article views including HTML views, PDF and ePub downloads, according to the available data) and Abstracts Views on Vision4Press platform.
Data correspond to usage on the plateform after 2015. The current usage metrics is available 48-96 hours after online publication and is updated daily on week days.
Initial download of the metrics may take a while.