Fig. 9
Download original image
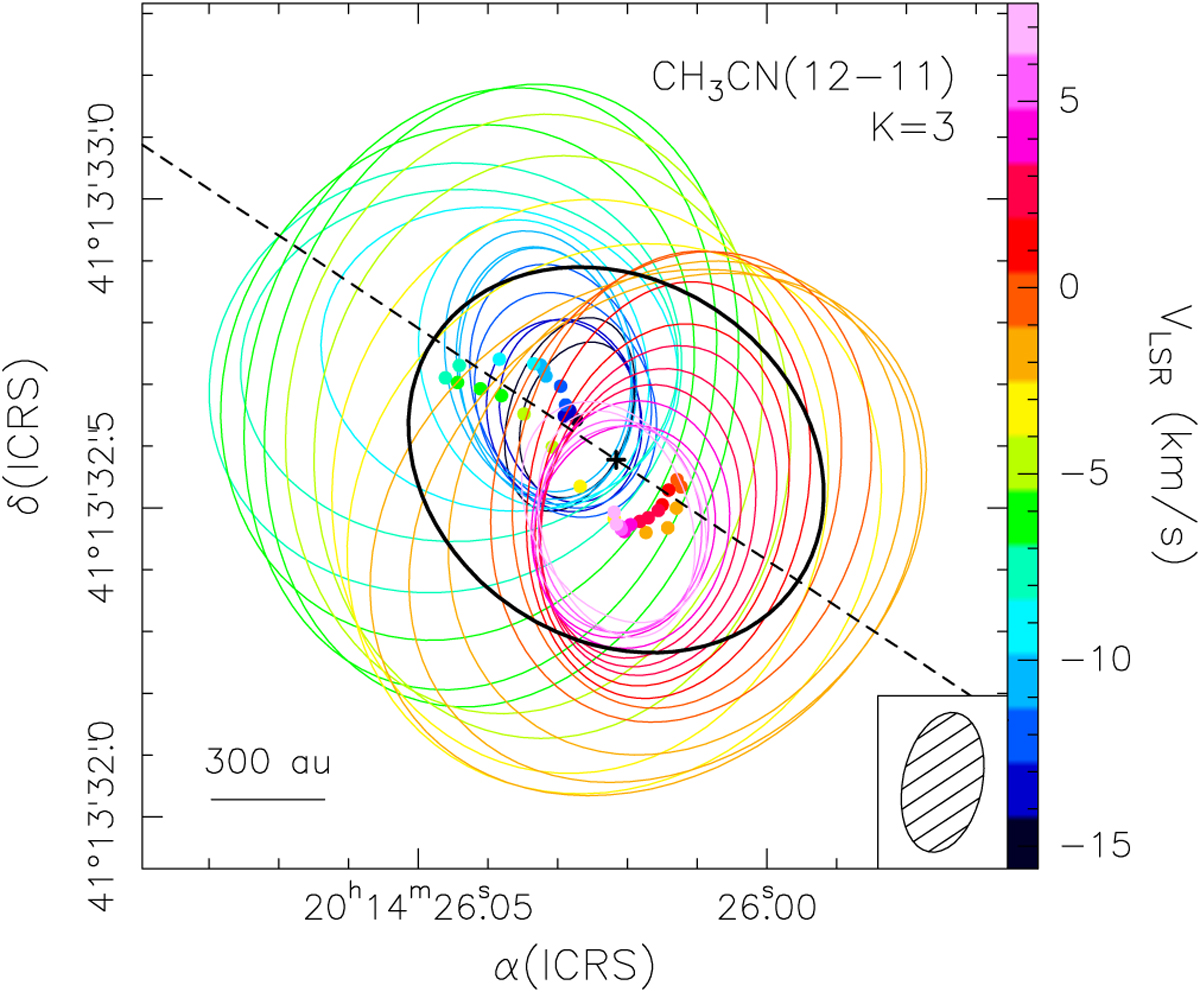
Distribution of the peaks (colored points) obtained by fitting a 2D Guassian to the emission in each channel of the channel maps of the CH3CN(12–11) K=3 line. The colored ellipses are the deconvolved FWHM of the fitted Gaussians. The color corresponds to the LSR velocity as indicated by the scale to the right. The black cross and ellipse represent the peak position and deconvolved FWHM of the 1.4 mm continuum emission, respectively. The dashed line outlines the direction of the major axis of the black ellipse. The shaded ellipse in the bottom right corner represents the synthesized beam.
Current usage metrics show cumulative count of Article Views (full-text article views including HTML views, PDF and ePub downloads, according to the available data) and Abstracts Views on Vision4Press platform.
Data correspond to usage on the plateform after 2015. The current usage metrics is available 48-96 hours after online publication and is updated daily on week days.
Initial download of the metrics may take a while.