Fig. 8
Download original image
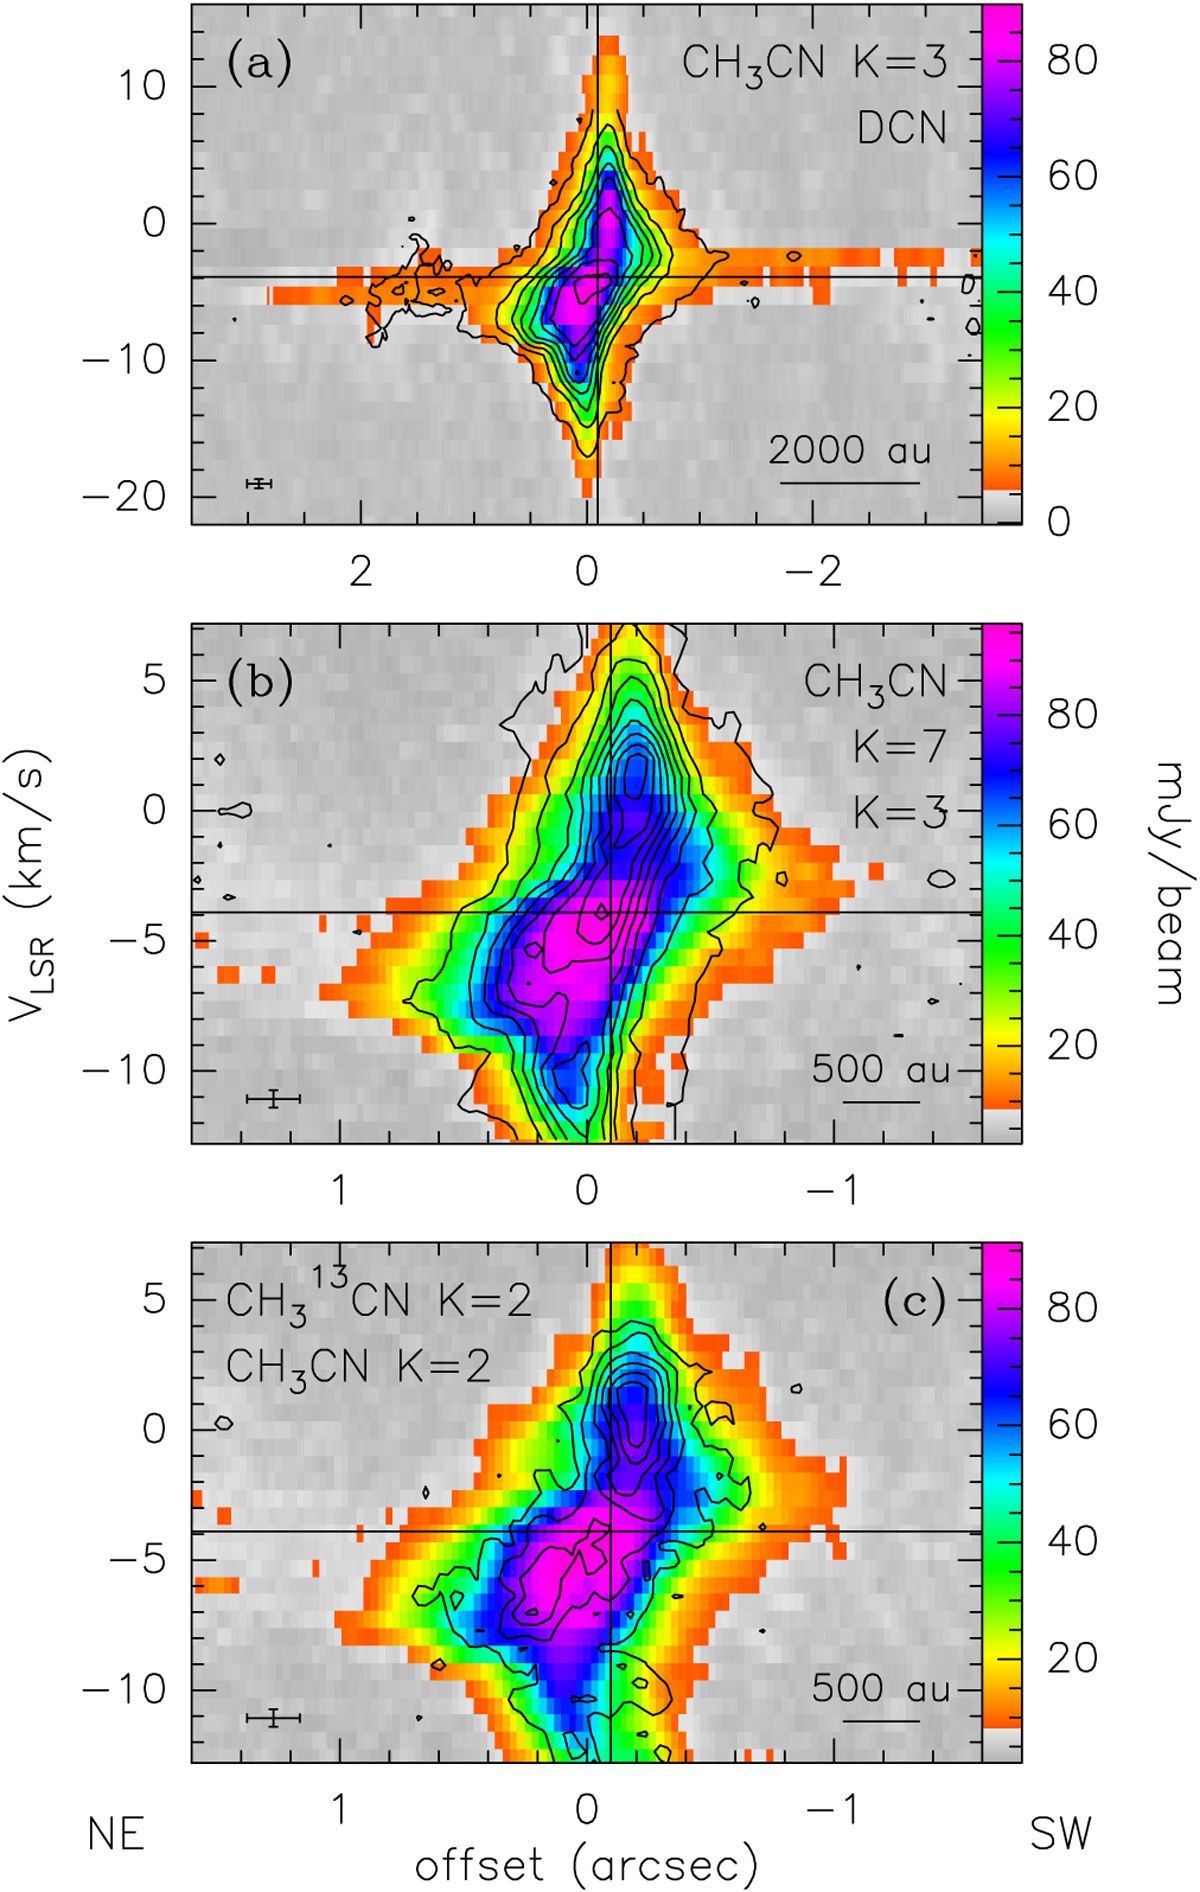
Moment-8 PV diagrams of various molecular transitions along the disk plane (PA=53°). The offset is relative to the phase center of the observations. The horizontal and vertical lines mark the systemic velocity and the position of the 1.4 mm continuum peak, respectively. The crosses in the bottom left corners indicate the angular and spectral resolutions. (a) PV plot of the CH3CN(12–11) K=3 component (contours) overlaid on that of the DCN(3–2) line. Contour levels range from 7 to 91 in steps of 12 mJy/beam. (b) Same as panel a, with CH3CN(12–11) K=7 overlaid on K=3. Contour levels range from 5 to 53 in steps of 6 mJ /beam. (c) Same as panel a, but with ![]() (12–11) K=2 overlaid on CH3CN(12–11) K=2. Contour levels range from 5 to 20 in steps of 3 mJy/beam.
(12–11) K=2 overlaid on CH3CN(12–11) K=2. Contour levels range from 5 to 20 in steps of 3 mJy/beam.
Current usage metrics show cumulative count of Article Views (full-text article views including HTML views, PDF and ePub downloads, according to the available data) and Abstracts Views on Vision4Press platform.
Data correspond to usage on the plateform after 2015. The current usage metrics is available 48-96 hours after online publication and is updated daily on week days.
Initial download of the metrics may take a while.