Open Access
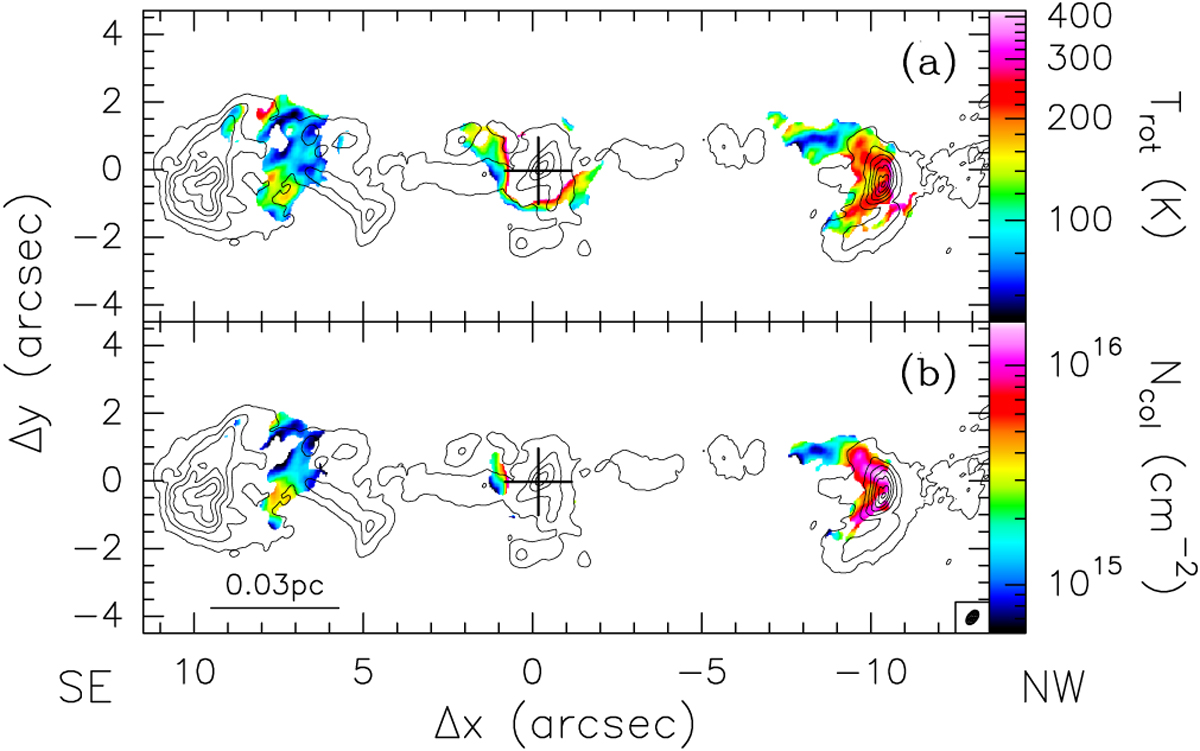
Fig. 7
Download original image
Contour map of the SiO emission (same as in Fig. 1a) overlaid on maps of the H2CO rotational temperature (panel a) and column density (panel b). The maps have been rotated by 30° clockwise. The ellipse in the bottom right corner denotes the synthesized beam. The cross marks the position of the 1.4 mm continuum peak.
Current usage metrics show cumulative count of Article Views (full-text article views including HTML views, PDF and ePub downloads, according to the available data) and Abstracts Views on Vision4Press platform.
Data correspond to usage on the plateform after 2015. The current usage metrics is available 48-96 hours after online publication and is updated daily on week days.
Initial download of the metrics may take a while.