Fig. 6
Download original image
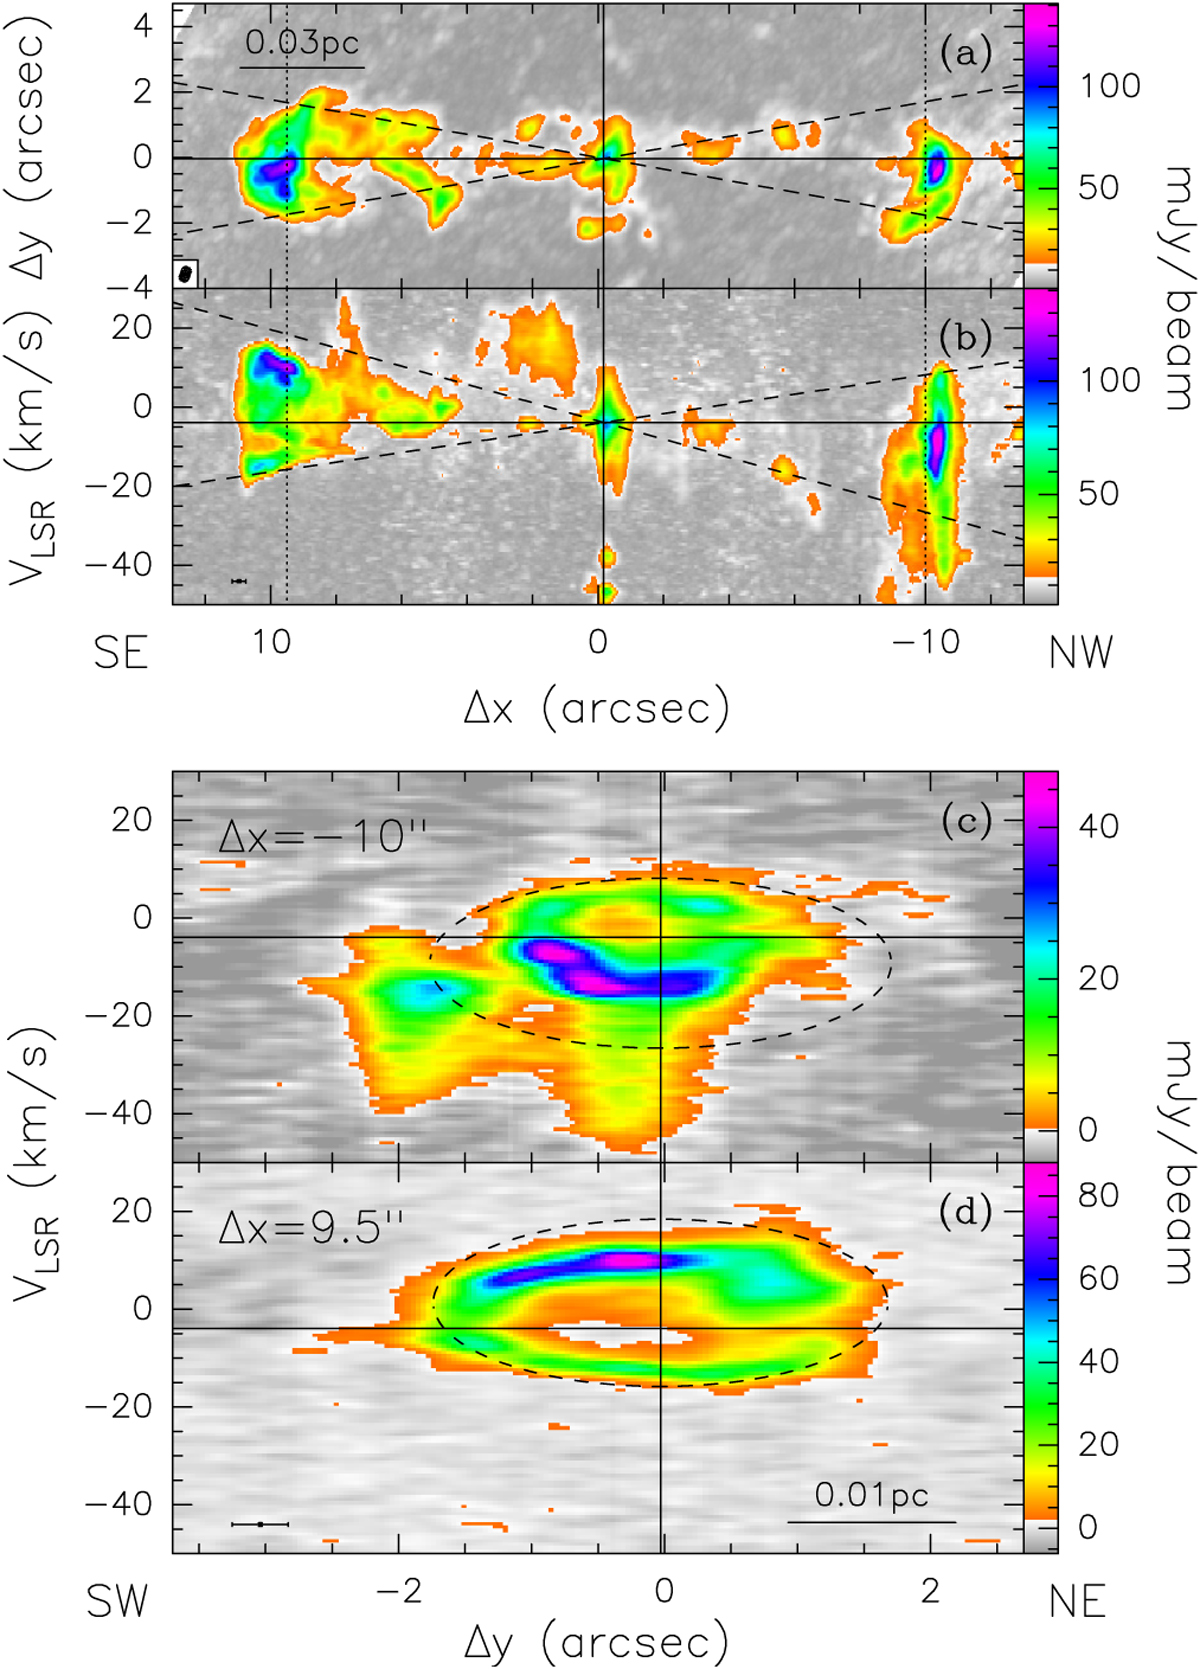
SiO(5–4) line emission in IRAS 20126+4104. The offsets are relative to the phase center of the observations. (a) Moment-8 map of the emission rotated by 30° clockwise, so that the jet axis lies parallel to the X-axis of the plot. The dotted lines indicate the cuts used to make the PV diagrams in panels c and d. According to our conical jet model, emission can be seen only in the region comprised between the two dashed lines. The horizontal and vertical lines mark the position of the 1.4 mm continuum peak. (b) Moment-8 PV diagram along the jet axis. The dotted lines have the same meaning as in panel a. The cross in the bottom left corner indicates the angular and spectral resolutions. The vertical line marks the position of the continuum peak and the horizontal line the systemic velocity of −3.9 km s−1. (c) PV diagram along the dotted line at offset ![]() in panel a. The dashed ellipse marks the region inside which emission is expected according to our conical jet model. The horizontal and vertical lines have the same meaning as in panel b. (d) PV diagram along the dotted line at offset −10″ in panel a. The dashed ellipse has the same meaning as in panel c. The cross in the bottom left corner denotes the angular and spectral resolutions. The horizontal and vertical lines have the same meaning as in panel b.
in panel a. The dashed ellipse marks the region inside which emission is expected according to our conical jet model. The horizontal and vertical lines have the same meaning as in panel b. (d) PV diagram along the dotted line at offset −10″ in panel a. The dashed ellipse has the same meaning as in panel c. The cross in the bottom left corner denotes the angular and spectral resolutions. The horizontal and vertical lines have the same meaning as in panel b.
Current usage metrics show cumulative count of Article Views (full-text article views including HTML views, PDF and ePub downloads, according to the available data) and Abstracts Views on Vision4Press platform.
Data correspond to usage on the plateform after 2015. The current usage metrics is available 48-96 hours after online publication and is updated daily on week days.
Initial download of the metrics may take a while.