Fig. 5
Download original image
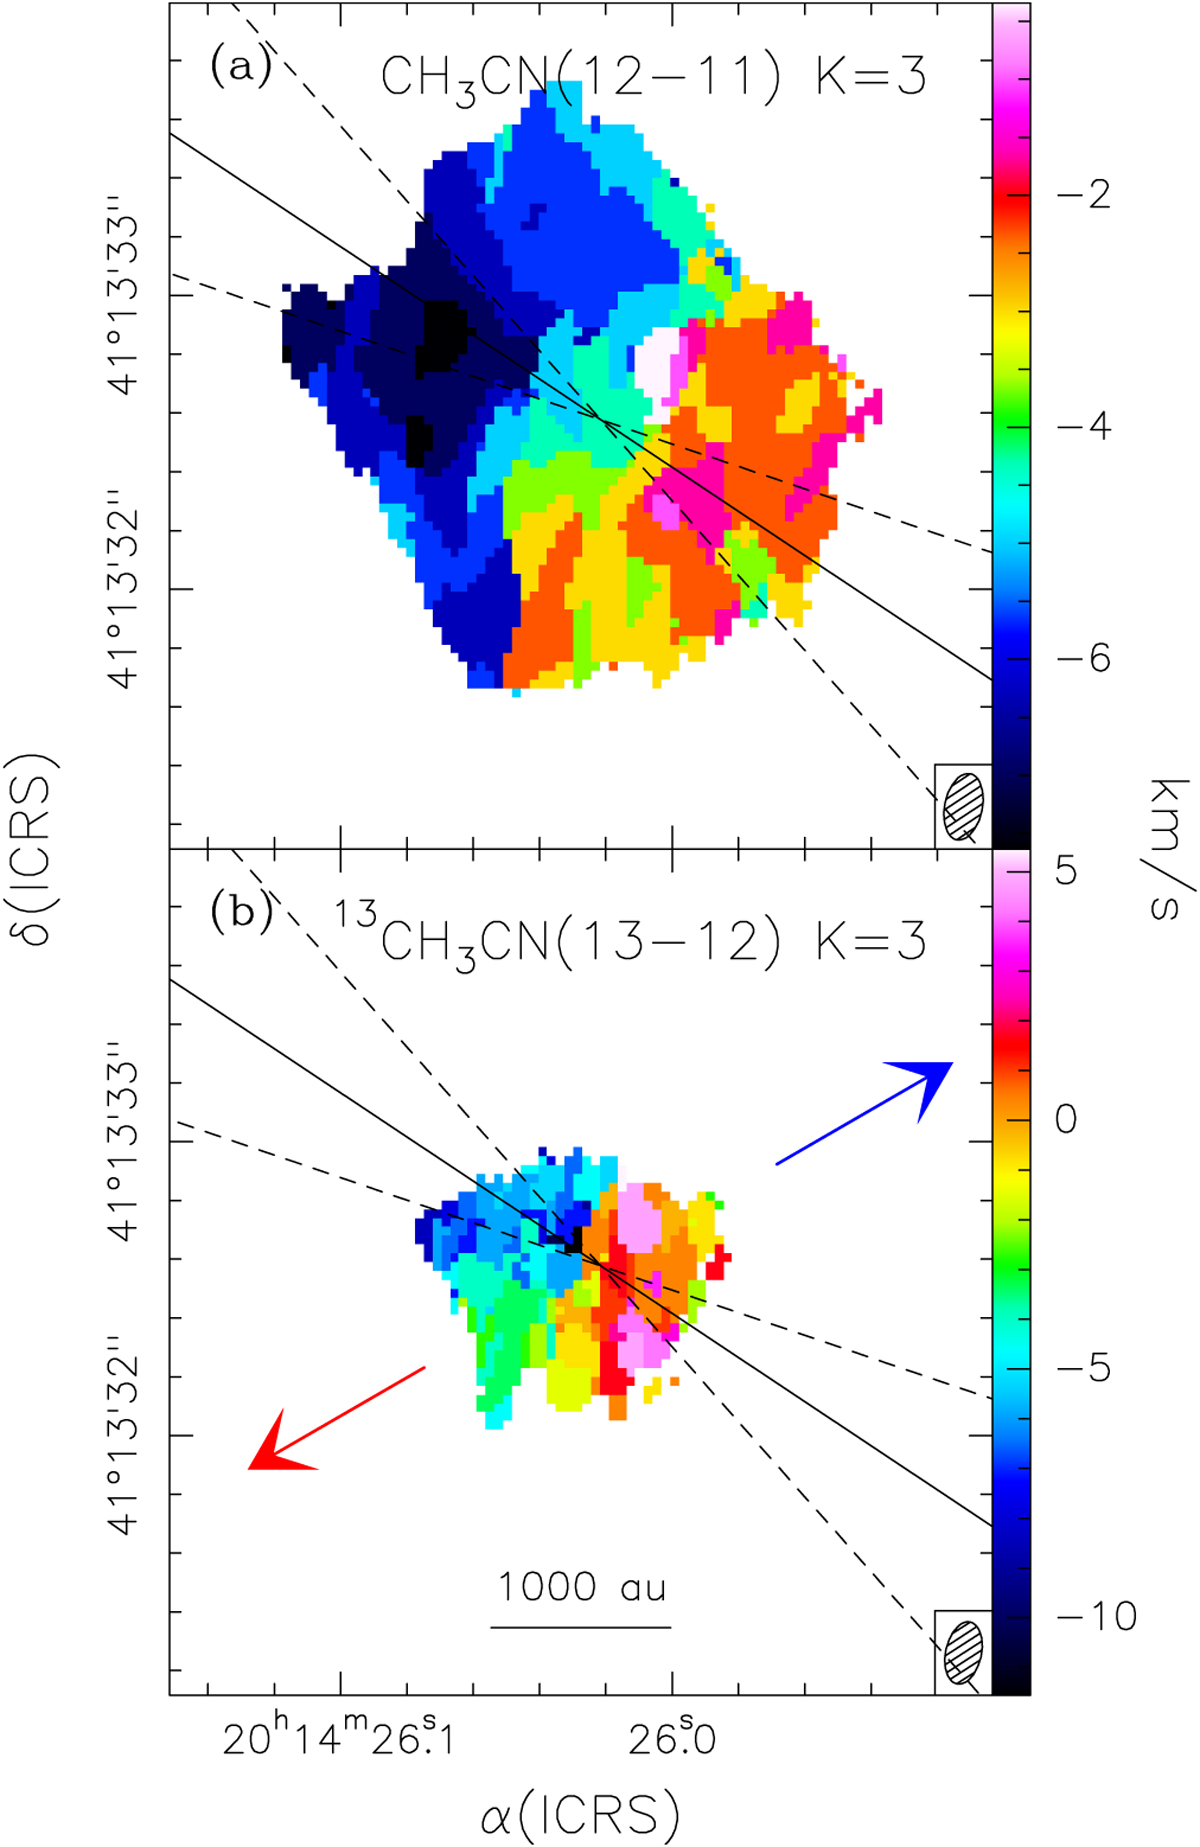
Moment-9 maps of the CH3CN(12–11) K=3 (panel a) and 13CH3CN(13–12) K=3 (panel b) lines. The systemic velocity is ~−3.9 km s−1. The solid line shows the deconvolved direction of the major axis of the continuum emission, while the dashed lines give the errors on this direction. The blue and red arrows indicate the directions of the blue- and redshifted lobes of the jet shown in Fig. 1. The ellipses in the bottom right corners denote the synthesized beams.
Current usage metrics show cumulative count of Article Views (full-text article views including HTML views, PDF and ePub downloads, according to the available data) and Abstracts Views on Vision4Press platform.
Data correspond to usage on the plateform after 2015. The current usage metrics is available 48-96 hours after online publication and is updated daily on week days.
Initial download of the metrics may take a while.