Fig. 3
Download original image
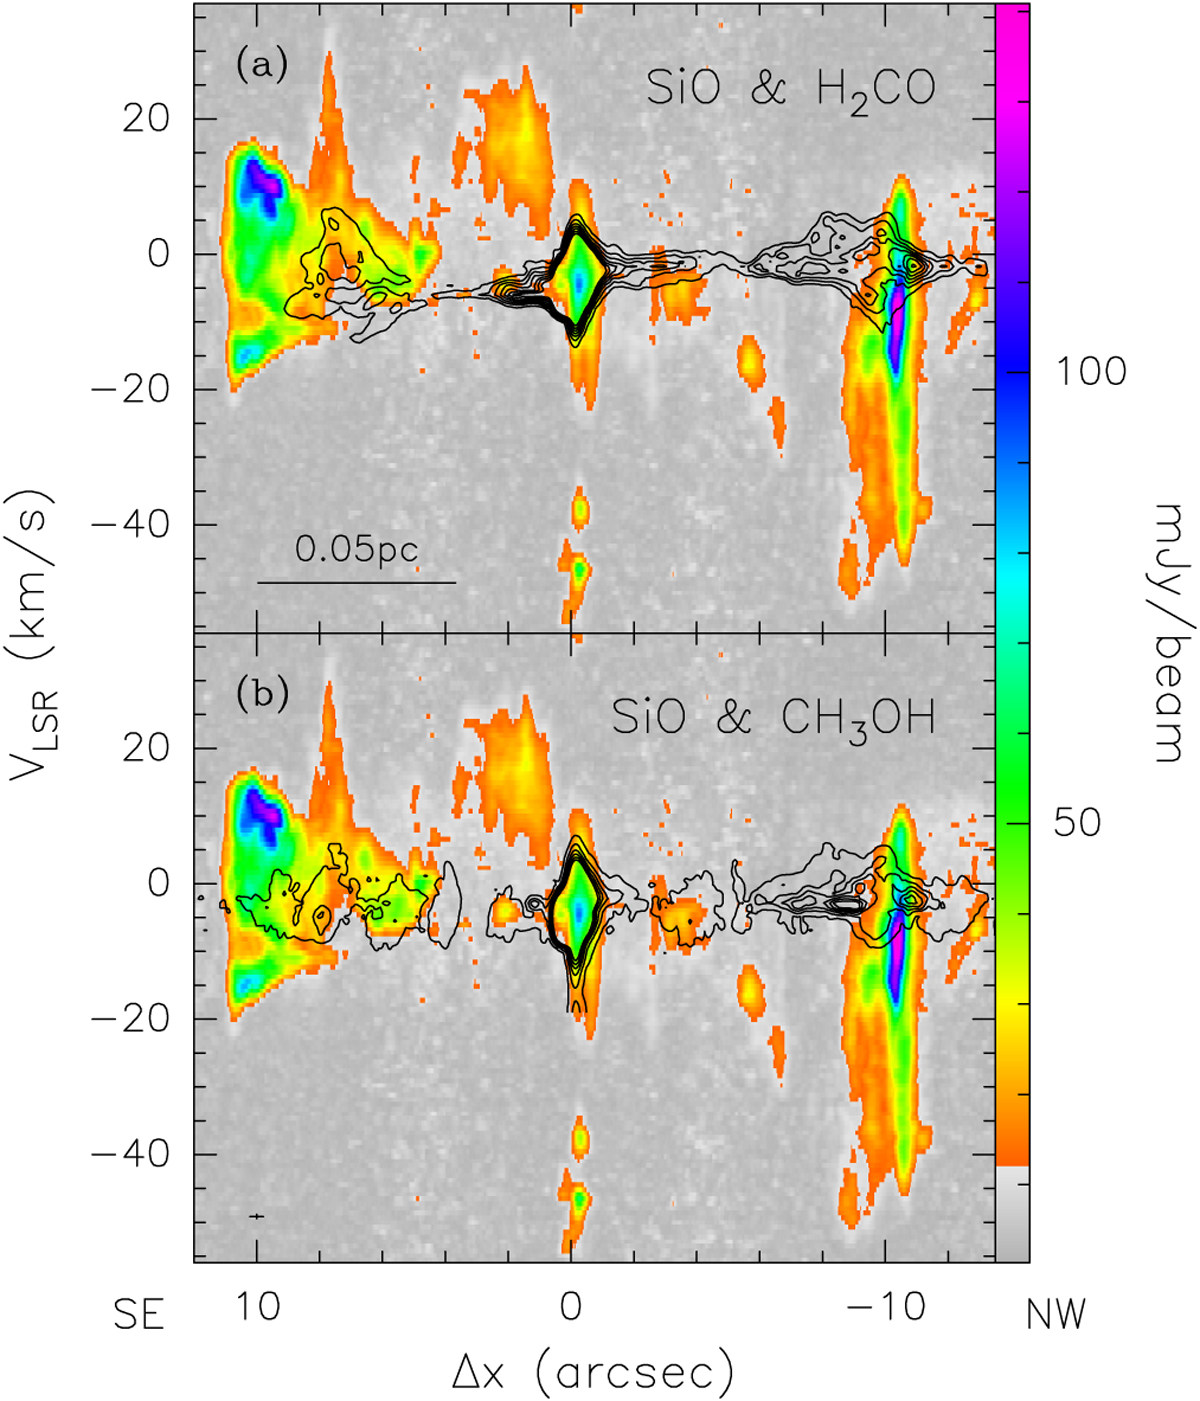
Moment-8 PV diagrams in three molecular tracers of the jet along the direction with a PA of −60°. The offset is relative to the phase center of the observations. The cross in the bottom left corner indicates the angular and spectral resolutions. (a) Contour map of the H2CO (30,3–20,2) line emission overlaid on the SiO(5–4) map. Contour levels range from 22 to 112 in steps of 15 mJy/beam. (b) Same as panel a but for the contour map of the CH3OH (4−2,3–3−1,2) E line emission. Contour levels range from 16.2 to 111.2 in steps of 19 mJy/beam.
Current usage metrics show cumulative count of Article Views (full-text article views including HTML views, PDF and ePub downloads, according to the available data) and Abstracts Views on Vision4Press platform.
Data correspond to usage on the plateform after 2015. The current usage metrics is available 48-96 hours after online publication and is updated daily on week days.
Initial download of the metrics may take a while.