Fig. 19
Download original image
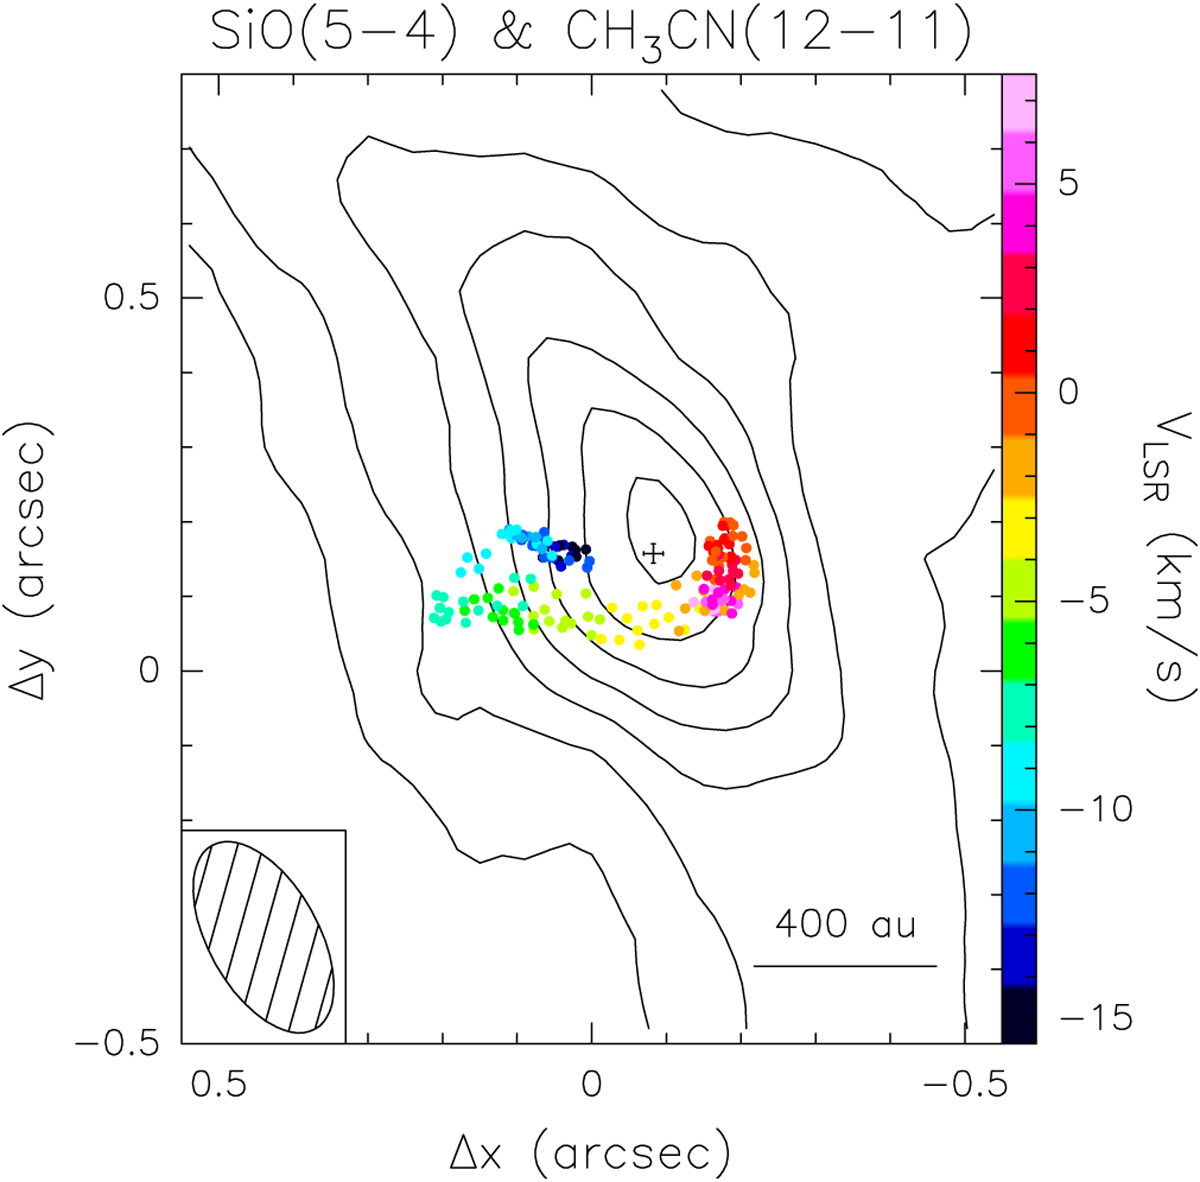
Overlay of the CH3CN peaks (circles) on the moment-8 map (contours) of the SiO(5–4) line emission. The colored points and black cross are the same as in Fig. 18. The maps have been rotated by 42° counterclockwise for consistency with Fig. 18 and the offsets are relative to the phase center of the observations. The contour levels range from 6 to 36 in steps of 5 mJy/beam. The ellipse in the bottom left corner denotes the synthesized beam of the SiO map.
Current usage metrics show cumulative count of Article Views (full-text article views including HTML views, PDF and ePub downloads, according to the available data) and Abstracts Views on Vision4Press platform.
Data correspond to usage on the plateform after 2015. The current usage metrics is available 48-96 hours after online publication and is updated daily on week days.
Initial download of the metrics may take a while.