Fig. 18
Download original image
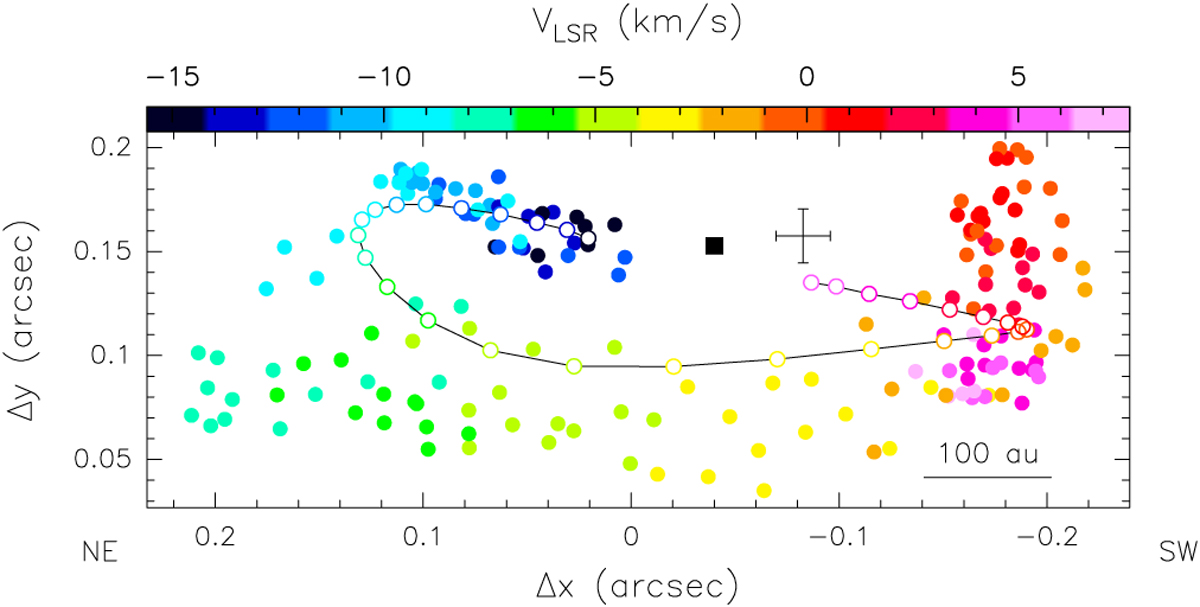
Comparison between the peaks of the CH3CN(12–11) K = 2, 3, 4, 5, 7, 8 components in the different velocity channels (solid circles) and those obtained from the model for a template line (empty circles connected by the solid line). We note that the model peak distribution qualitatively reproduces the C-shaped pattern described by the data. The system is rotated clockwise by 42° and the offsets are relative to the phase center of the observations. The color indicates the LSR velocity. The black square marks the center of the disk according to the model. The black cross indicates the position of the 1.4 mm continuum peak with error bars.
Current usage metrics show cumulative count of Article Views (full-text article views including HTML views, PDF and ePub downloads, according to the available data) and Abstracts Views on Vision4Press platform.
Data correspond to usage on the plateform after 2015. The current usage metrics is available 48-96 hours after online publication and is updated daily on week days.
Initial download of the metrics may take a while.