Fig. 17
Download original image
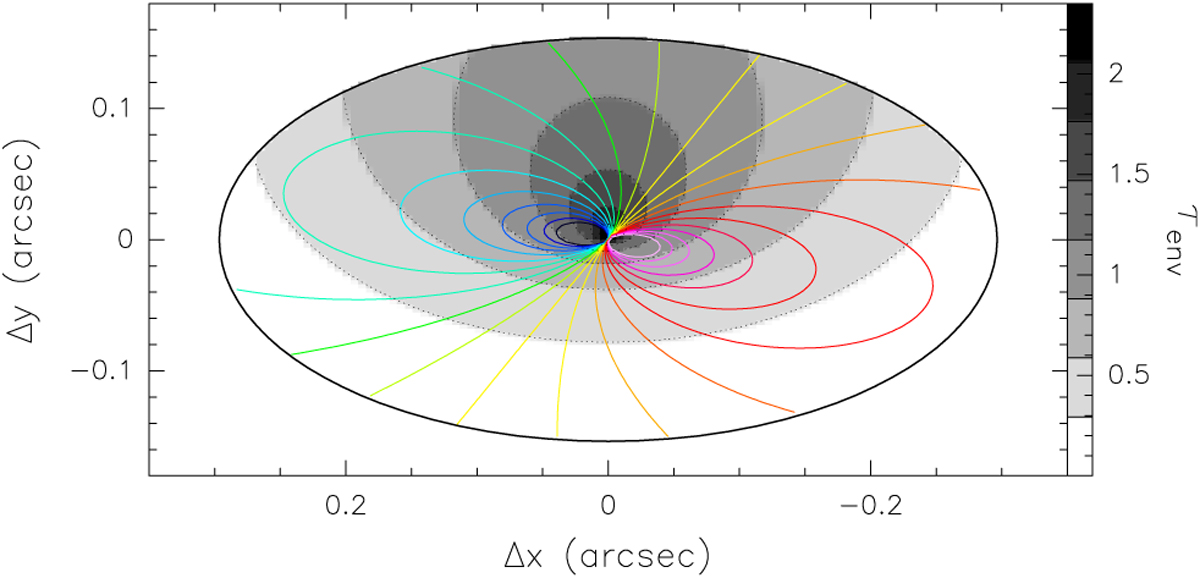
Maps of the velocity and dust opacity over the disk according to our model. The black ellipse outlines the border of the disk and the color-coded patterns are the loci of points of the disk with the same velocity along the line of sight, ranging from −10 to +10 in steps of 1 km s−1. The gray scale with dotted contours is a map of the envelope dust opacity.
Current usage metrics show cumulative count of Article Views (full-text article views including HTML views, PDF and ePub downloads, according to the available data) and Abstracts Views on Vision4Press platform.
Data correspond to usage on the plateform after 2015. The current usage metrics is available 48-96 hours after online publication and is updated daily on week days.
Initial download of the metrics may take a while.