Fig. 15
Download original image
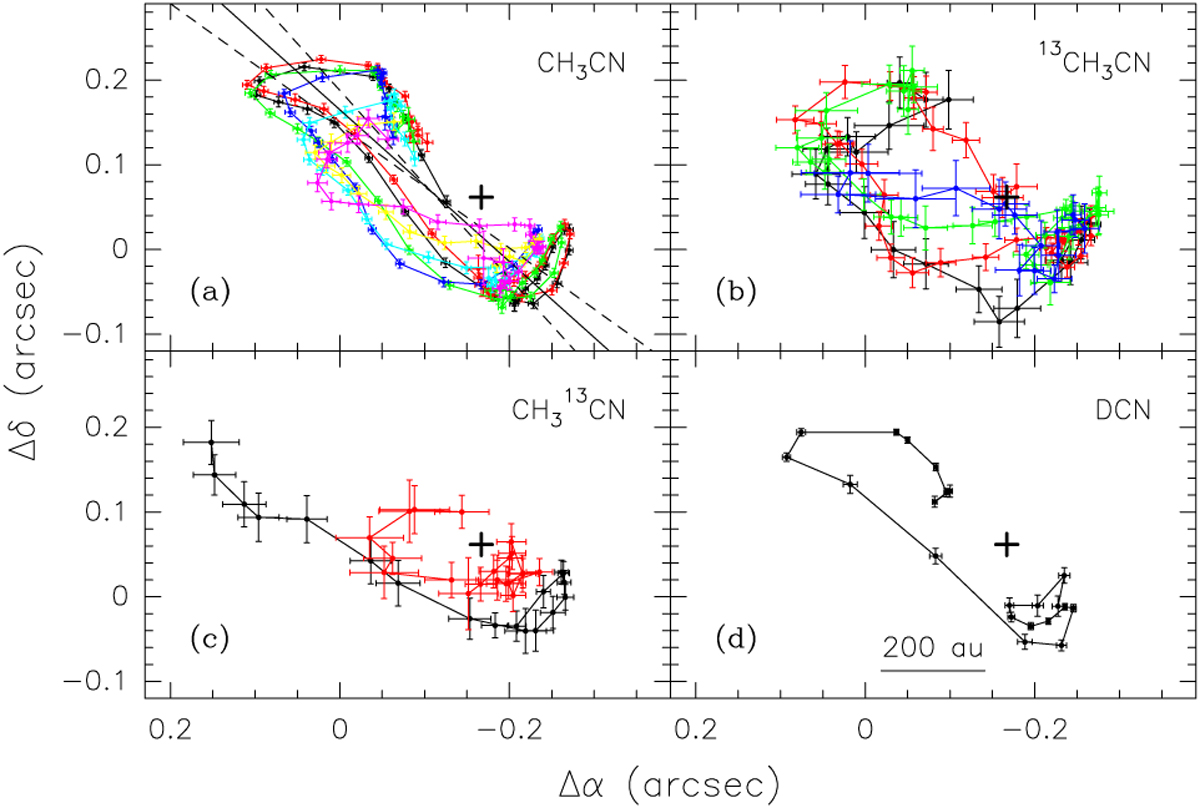
Distributions of the peaks of the emission in the velocity channels of various lines observed in IRAS 20126+4104. The error bars are the formal errors on the Gaussian fits. The offsets are relative to the phase center of the observations. The black cross marks the position of the 1.4 mm continuum peak. (a) Plot obtained from the CH3CN(12–11) lines. The color coding is as follows: K=2 black, 3 red, 4 green, 5 blue, 7 cyan, 8 yellow, and v8=1 magenta. The dashed lines are linear fits to the points obtained by fitting Y vs X and X vs Y; the solid line is the mean of the two. (b) Same as panel a but for the 13CH3CN(13–12) components: K=2 black, 3 red, 4 green, and 5 blue. (c) Same as panel a but for the ![]() (12–11) components: K=2 black, 4 red. (d) Same as panel a but for the DCN(3–2) line.
(12–11) components: K=2 black, 4 red. (d) Same as panel a but for the DCN(3–2) line.
Current usage metrics show cumulative count of Article Views (full-text article views including HTML views, PDF and ePub downloads, according to the available data) and Abstracts Views on Vision4Press platform.
Data correspond to usage on the plateform after 2015. The current usage metrics is available 48-96 hours after online publication and is updated daily on week days.
Initial download of the metrics may take a while.