Open Access
Fig. 14
Download original image
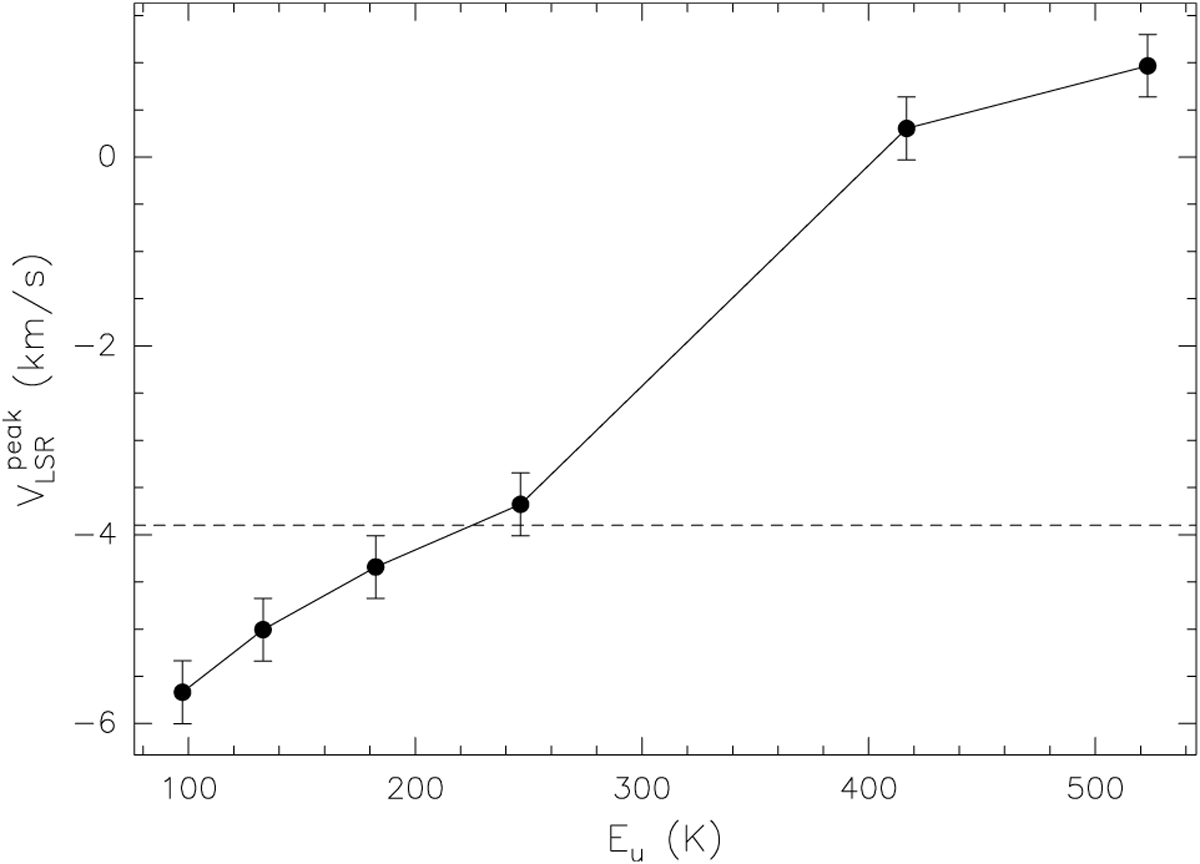
LSR velocity corresponding to the peak emission in the PV diagrams of the CH3CN(12–11) K = 2, 3, 4, 5, 7, 8 lines as a function of the upper energy of the transition. The dashed line marks the systemic LSR velocity of −3.9 km s−1.
Current usage metrics show cumulative count of Article Views (full-text article views including HTML views, PDF and ePub downloads, according to the available data) and Abstracts Views on Vision4Press platform.
Data correspond to usage on the plateform after 2015. The current usage metrics is available 48-96 hours after online publication and is updated daily on week days.
Initial download of the metrics may take a while.