Fig. 13
Download original image
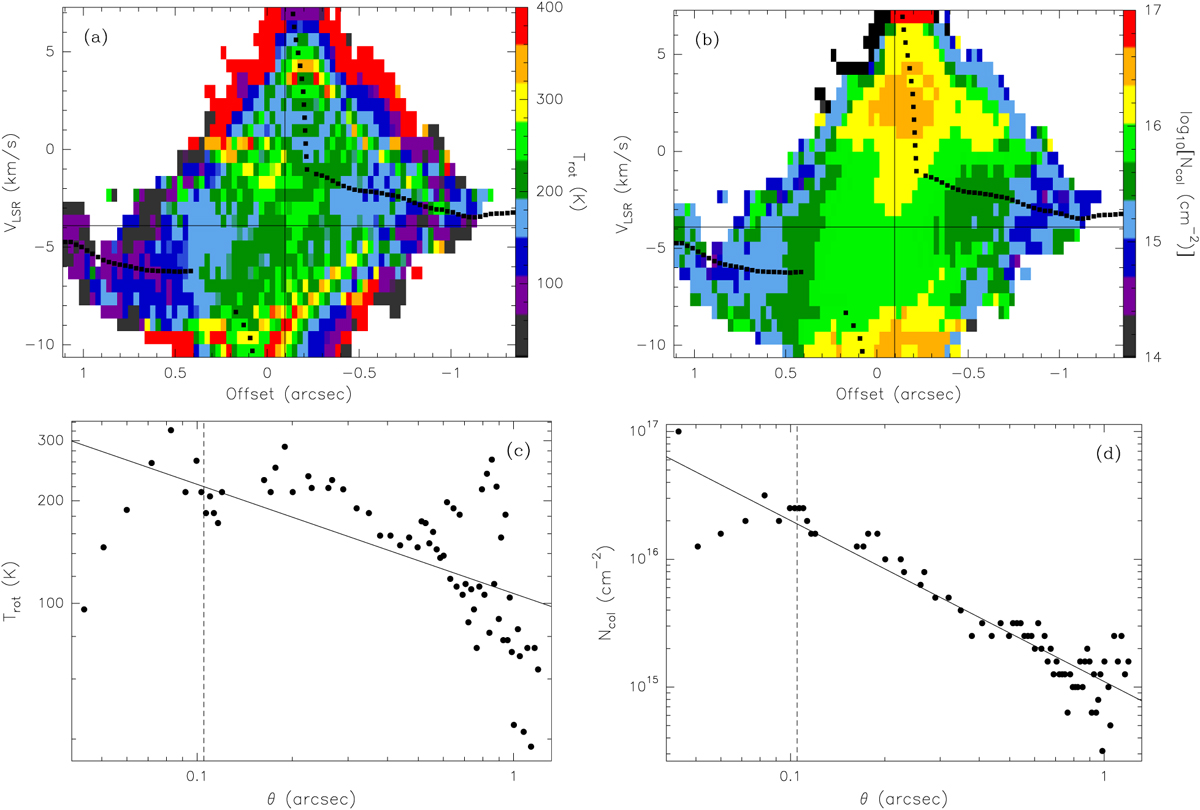
Analysis of the temperature and column density distribution in the disk around IRAS 20126+4104. (a) PV diagram along the disk plane of the CH3CN rotation temperature obtained by fitting the brightness temperature of selected transitions. The black solid squares mark the points used to derive Trot as a function of radius (see text). (b) Same as panel a but for the CH3CN column density. (c) Rotation temperature versus angular radius obtained from the points of the PV diagram marked by the black solid squares. The solid line is a linear fit to the data corresponding to the relation Trot(K) = 107 [θ(arcsec)]−0.32. The dashed line corresponds to half the synthesized beam. (d) Same as panel c but for the CH3CN column density. The relationship obtained from the linear fit to the data is Ncol(cm−2) = 1.1 × 10¹⁵ [θ(arcsec)]−1.3.
Current usage metrics show cumulative count of Article Views (full-text article views including HTML views, PDF and ePub downloads, according to the available data) and Abstracts Views on Vision4Press platform.
Data correspond to usage on the plateform after 2015. The current usage metrics is available 48-96 hours after online publication and is updated daily on week days.
Initial download of the metrics may take a while.