Fig. 12
Download original image
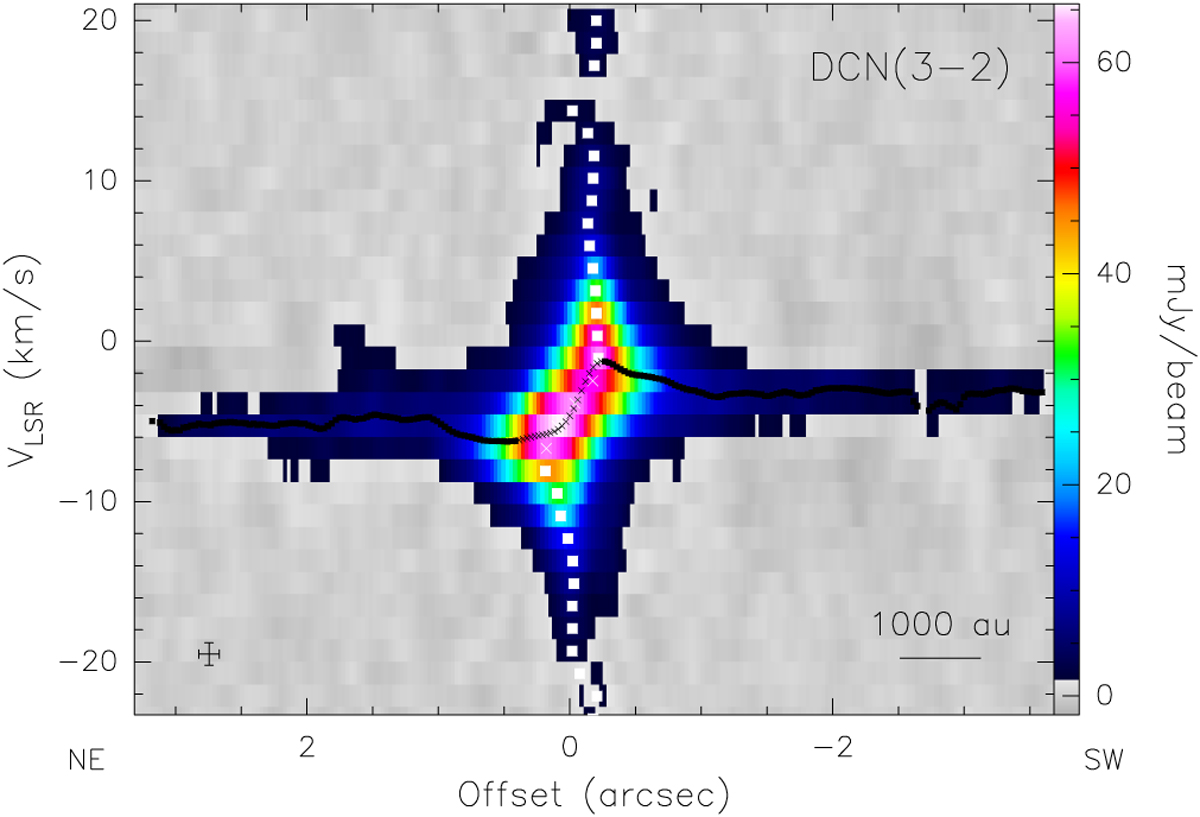
Moment-8 PV diagram of the DCN(3–2) line emission along the plane of the disk (PA=53°). The offset is relative to the phase center of the observations. The black and white points mark the emission peaks obtained by fitting a Gaussian to the emission, respectively, for fixed offset and fixed velocity. The solid squares indicate the points selected by us to define the velocity–radius relation in the Keplerian disk.
Current usage metrics show cumulative count of Article Views (full-text article views including HTML views, PDF and ePub downloads, according to the available data) and Abstracts Views on Vision4Press platform.
Data correspond to usage on the plateform after 2015. The current usage metrics is available 48-96 hours after online publication and is updated daily on week days.
Initial download of the metrics may take a while.