Fig. 11
Download original image
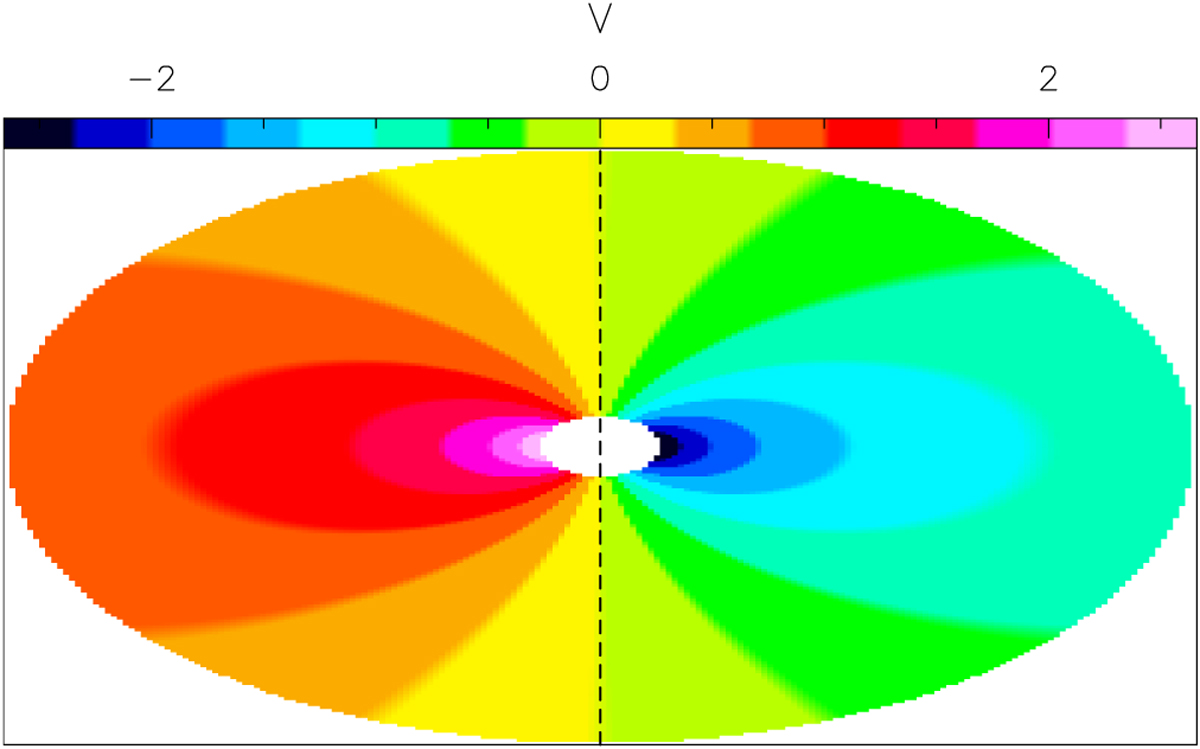
Schematic plot of the velocity along the line of sight relative to the star velocity, in a template Keplerian disk inclined by 30°. The plane of the figure is the plane of the sky and the dashed line is the projection of the disk rotation axis. The color scale indicating the velocity is in arbitrary units. We note that the high-velocity magenta/red and blue patterns are elongated perpendicular to the yellow/green patterns, which correspond to velocities close to zero.
Current usage metrics show cumulative count of Article Views (full-text article views including HTML views, PDF and ePub downloads, according to the available data) and Abstracts Views on Vision4Press platform.
Data correspond to usage on the plateform after 2015. The current usage metrics is available 48-96 hours after online publication and is updated daily on week days.
Initial download of the metrics may take a while.