Fig. 1
Download original image
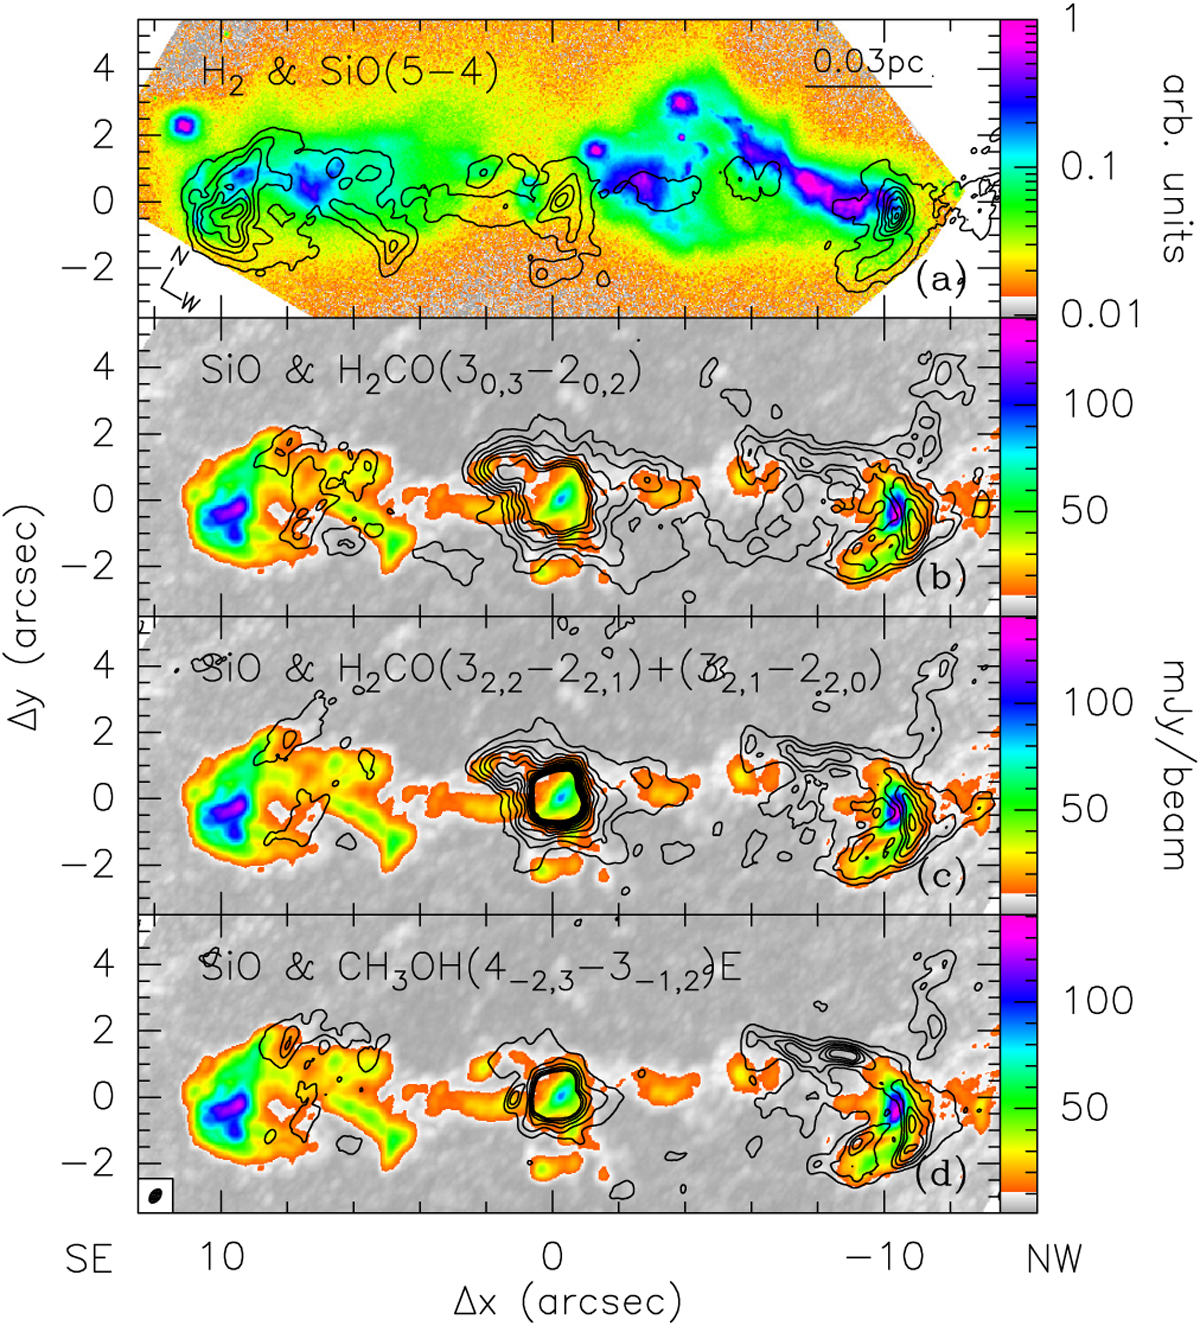
Moment-8 maps in various molecular tracers of the jet in IRAS 20126+4104. All maps have been rotated by 30° clockwise so that the jet axis lies parallel to the X-axis of the plot. The offset is relative to the phase center of the observations. The ellipse in the bottom left corner indicates the synthesized beam of the ALMA maps. (a) Contour map of the SiO(5–4) line emission overlaid on the image of the H2 2.12 μm line obtained by Cesaroni et al. (2013). Contour levels range from 10.4 to 136.4 in steps of 21 mJy/beam. (b) Contour map of the H2CO (30,3–20,2) line emission overlaid on the same SiO(5–4) image as in panel a. Contour levels range from 27 to 117 in steps of 15 mJy/beam. (c) Same as panel b but for the contour map of the average emission in the H2CO (32,2–22,1) and (32,1–22,0) lines. Contour levels range from 12 to 111 in steps of 9 mJy/beam. (d) Same as panel b but for the contour map of the CH3OH (4−2,3–3−1,2) E line emission. Contour levels range from 16.2 to 111.2 in steps of 19 mJy/beam.
Current usage metrics show cumulative count of Article Views (full-text article views including HTML views, PDF and ePub downloads, according to the available data) and Abstracts Views on Vision4Press platform.
Data correspond to usage on the plateform after 2015. The current usage metrics is available 48-96 hours after online publication and is updated daily on week days.
Initial download of the metrics may take a while.