Fig. 9
Download original image
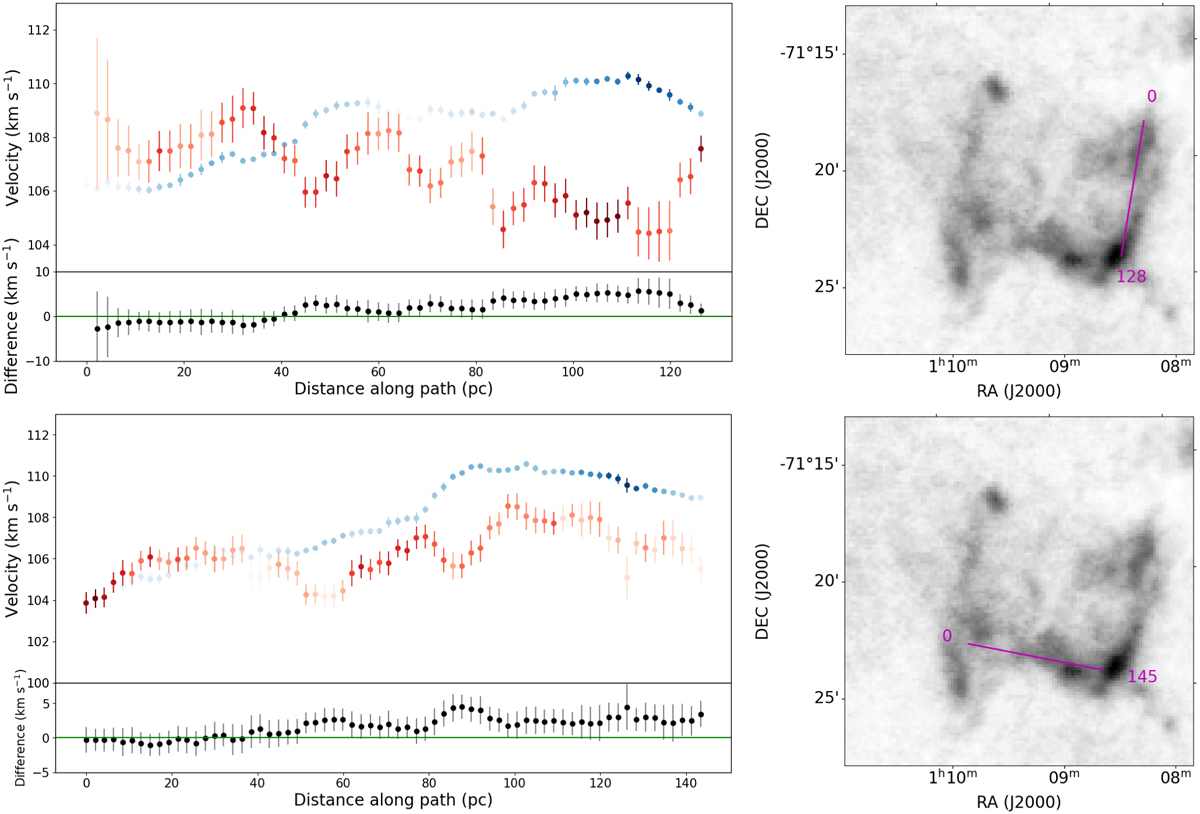
Left: fitted component central velocities for the different phases for two different paths through the Alpha cloud (top and bottom). The WNM is shown in red, the CNM in blue with the darker colours indicating higher column density. The error bars in the top panels show the 1σ uncertainties from Section 3.3. The error bars in the bottom panels show the combined uncertainties at the 3σ level. Right: path through the cloud for respective velocity relations shown in purple. 0 denotes the start of the path, and 128 and 145 denote the ends of each path.
Current usage metrics show cumulative count of Article Views (full-text article views including HTML views, PDF and ePub downloads, according to the available data) and Abstracts Views on Vision4Press platform.
Data correspond to usage on the plateform after 2015. The current usage metrics is available 48-96 hours after online publication and is updated daily on week days.
Initial download of the metrics may take a while.