Fig. 2
Download original image
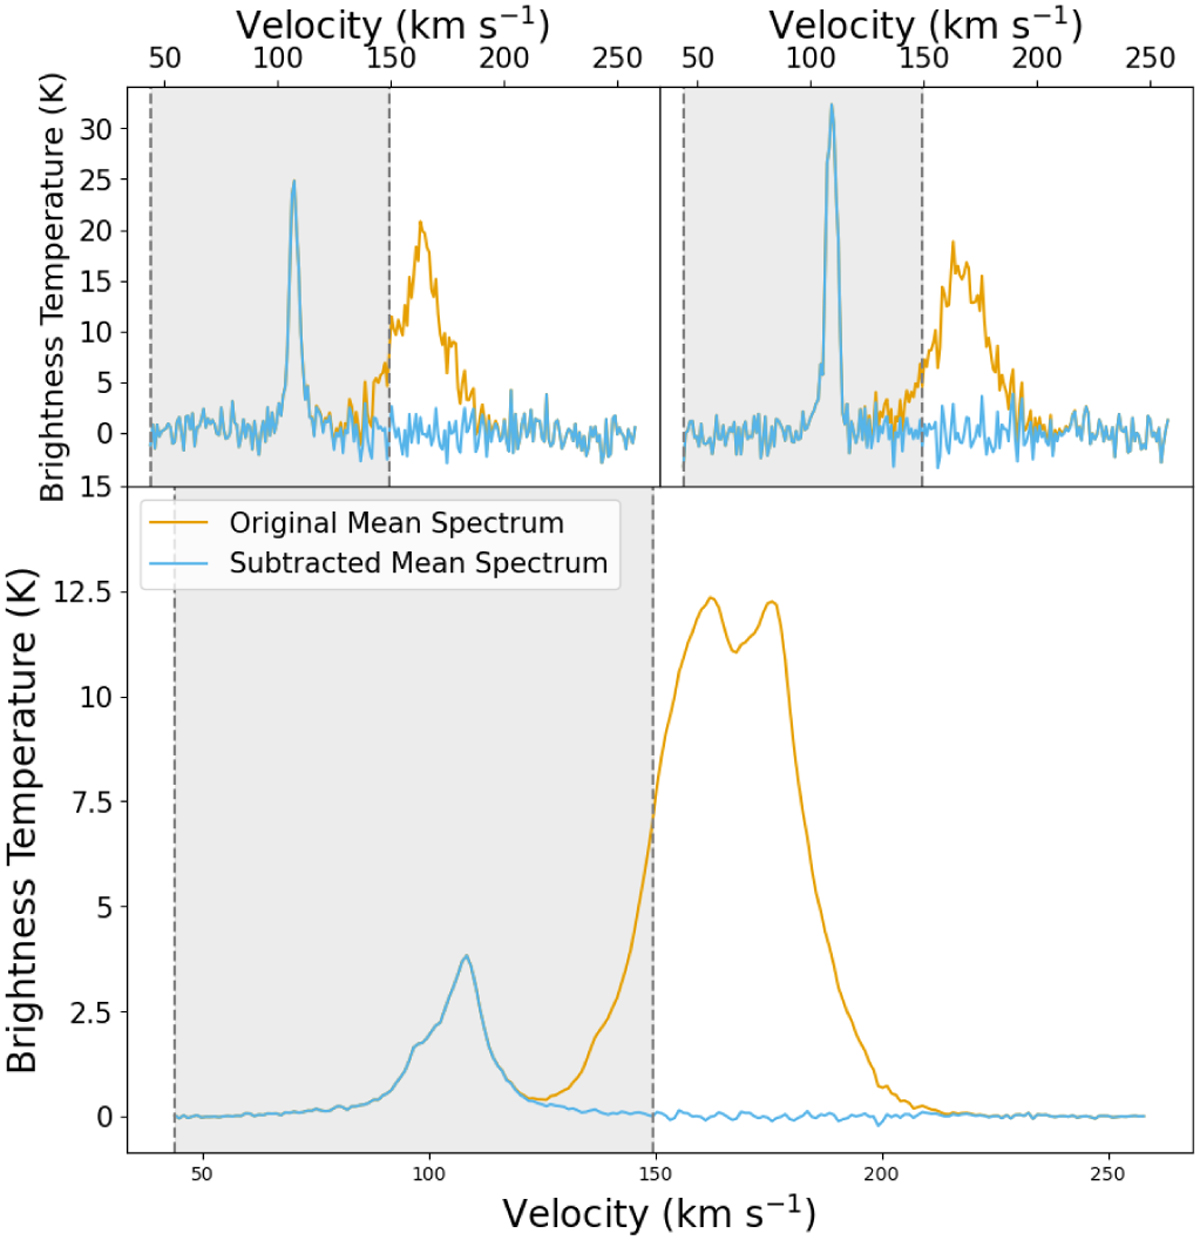
Example spectra from the Alpha cloud field. Bottom: mean spectrum of the field before (orange) and after (blue) subtraction of the main body emission signal. Top: spectra of two separate sightlines with the same colours indicating the spectra before and after subtraction. The grey windows show the spectral range retained for the fitting described in Section 3.2.3.
Current usage metrics show cumulative count of Article Views (full-text article views including HTML views, PDF and ePub downloads, according to the available data) and Abstracts Views on Vision4Press platform.
Data correspond to usage on the plateform after 2015. The current usage metrics is available 48-96 hours after online publication and is updated daily on week days.
Initial download of the metrics may take a while.