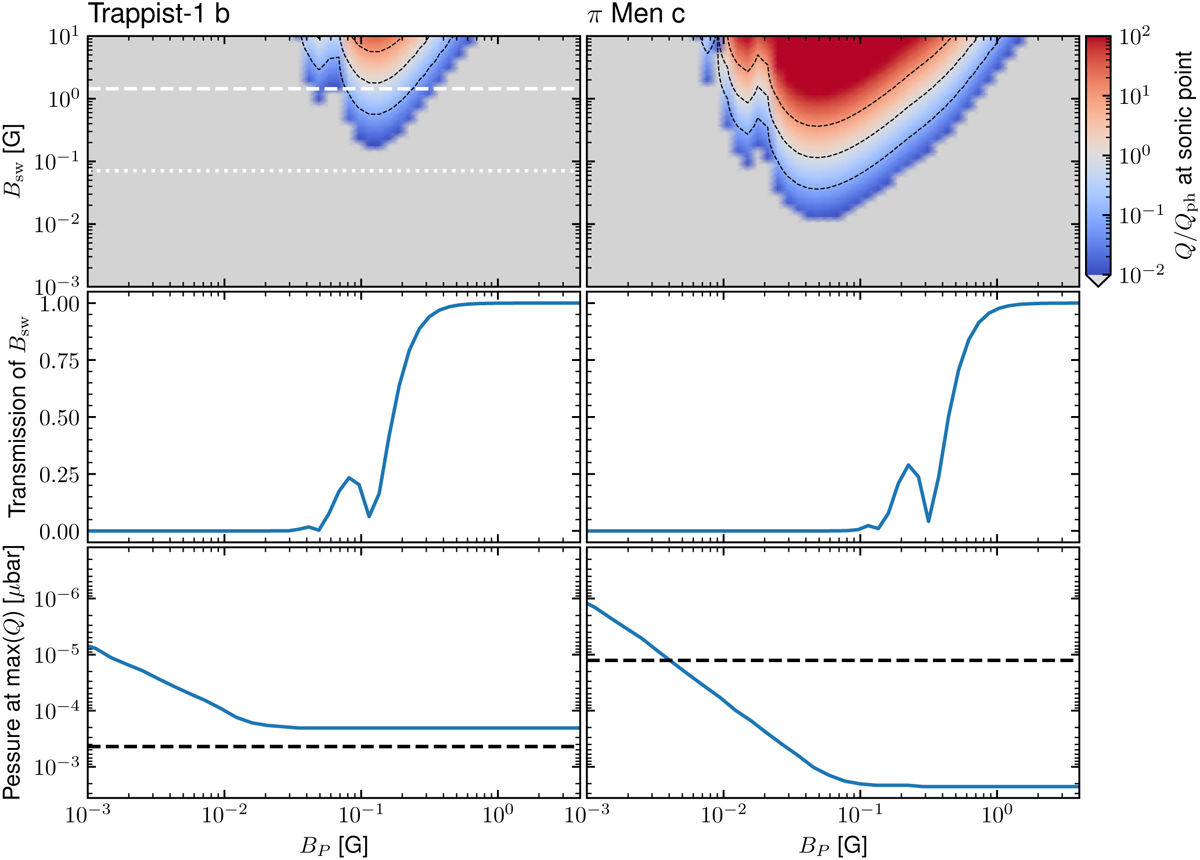
Fig. 6
Download original image
Ohmic heating and field transmission in the upper atmospheres of Trappist-1 b (left column) and π Men c (right column). The upper panels show the heating rate Q at the sonic point rc divided by the heating from photochemistry Qph at the same location, as function of the planetary field BP and the stellar wind field Bsw. Blue corresponds to (Q/Qph)(rc) = 0.01 and red to (Q/Qph)(rc) = 100. Values below 0.01 are shown in gray. The dashed and dotted white lines in the top left panel correspond to estimates of the ambient magnetic field based on observations of the magnetic field at the surface of Trappist-1 (Reiners & Basri 2010). We note that we have no such constraints for π Men at the moment. The thin dashed lines correspond to contours of the ratio of 0.1, 1 and 10. The middle panels show the transmission of Bsw from the top of the atmosphere to the level of 1 µbar, as a function BP (1 corresponds to a full transmission, 0 to a full screening). The bottom panels show the altitude (in pressure value) at which the maximal Ohmic heating rate is realized as a function of BP. The pressure at the sonic point is shown by the black dashed line.
Current usage metrics show cumulative count of Article Views (full-text article views including HTML views, PDF and ePub downloads, according to the available data) and Abstracts Views on Vision4Press platform.
Data correspond to usage on the plateform after 2015. The current usage metrics is available 48-96 hours after online publication and is updated daily on week days.
Initial download of the metrics may take a while.