Fig. D.1
Download original image
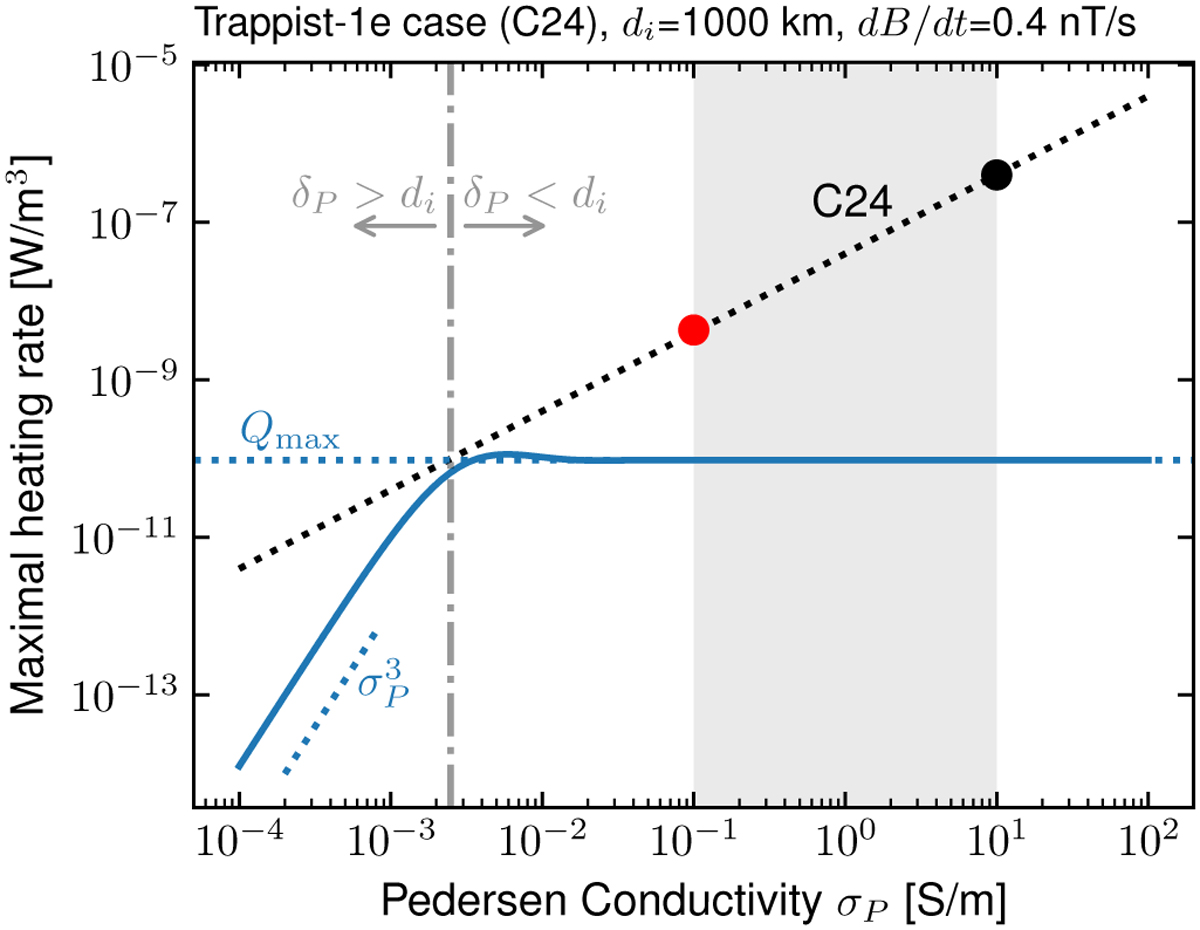
Comparison to the modeling of C24 for their case of Trappist- 1 e, i.e., for a layer di =1000 km and a magnetic field variation dB/dt = 0.4 nT/s. We made use of their Eq. 13 to trace Q as a function of σP (black dotted line). The red and black circles correspond to the red and black circles in their Figure 4 (in the case di=1000 km). The gray area labels the range of application considered in C24. The results of our model are shown by the blue line. The maximal heating rate Qmax is labeled by the dotted blue line. The vertical dash-dotted gray line labels the Pedersen conductivity ![]() for which δP = di.
for which δP = di.
Current usage metrics show cumulative count of Article Views (full-text article views including HTML views, PDF and ePub downloads, according to the available data) and Abstracts Views on Vision4Press platform.
Data correspond to usage on the plateform after 2015. The current usage metrics is available 48-96 hours after online publication and is updated daily on week days.
Initial download of the metrics may take a while.