Fig. A.1.
Download original image
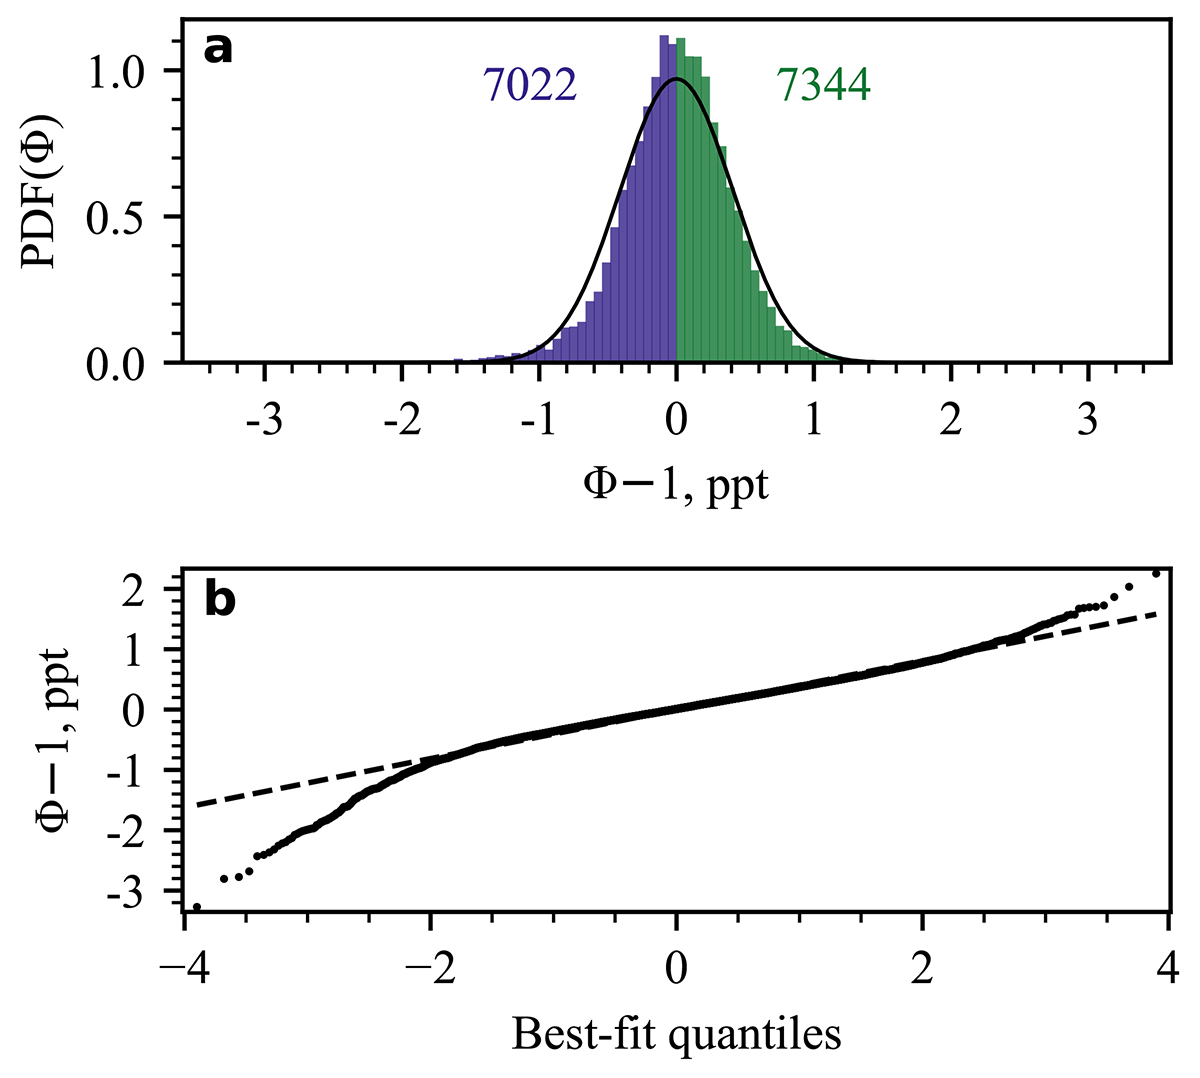
Characteristics of detrended PDCSAP photometry. (a) Distribution plot, conventionally split in two into a lower distribution (blue bars) and an upper distribution (green bars). The size of these sub-distributions are given in figures of corresponding colour. A Gaussian-fuction fit to the distribution is given as a black solid line. (b) Probability plot assessing whether the full distribution (black solid line) follows the fitted Gaussian (black dashed line).
Current usage metrics show cumulative count of Article Views (full-text article views including HTML views, PDF and ePub downloads, according to the available data) and Abstracts Views on Vision4Press platform.
Data correspond to usage on the plateform after 2015. The current usage metrics is available 48-96 hours after online publication and is updated daily on week days.
Initial download of the metrics may take a while.