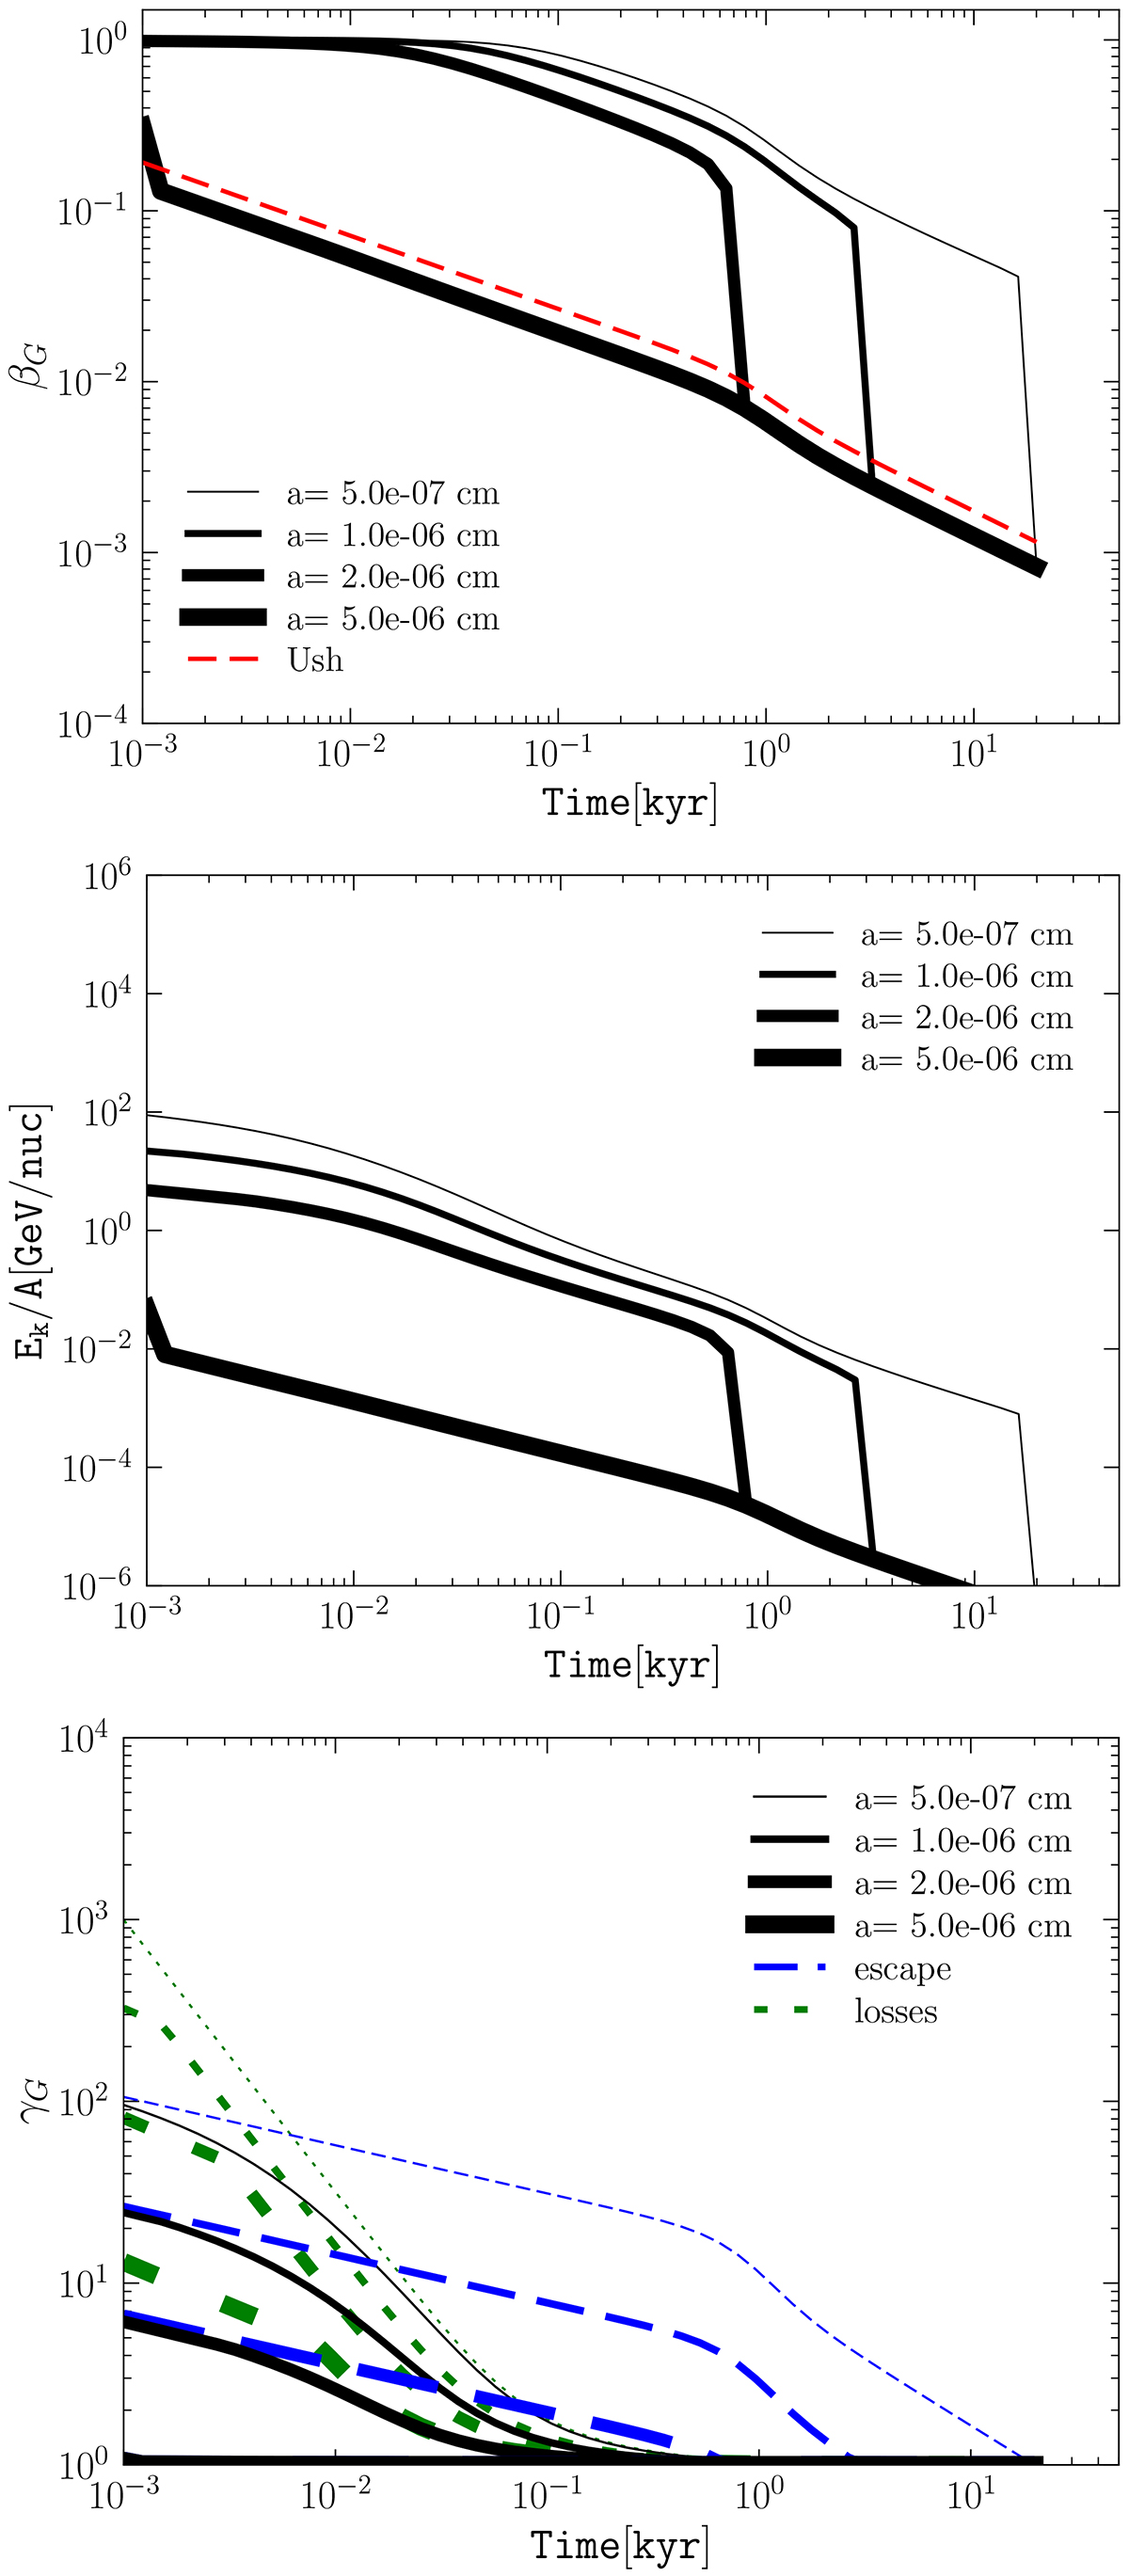
Fig. 2.
Download original image
Maximum velocity (top), kinetic energy (middle), and Lorentz factor (bottom) of accelerated silicate grains, with the grain size increasing from thin to thick. The dashed red curve in the top panel shows the evolution of the shock velocity. In the bottom panel, the dashed blue and dotted green lines correspond to the maximum Lorentz factor obtained with the escape condition (Eq. (20)) and with the loss condition (Eq. (13)), respectively.
Current usage metrics show cumulative count of Article Views (full-text article views including HTML views, PDF and ePub downloads, according to the available data) and Abstracts Views on Vision4Press platform.
Data correspond to usage on the plateform after 2015. The current usage metrics is available 48-96 hours after online publication and is updated daily on week days.
Initial download of the metrics may take a while.