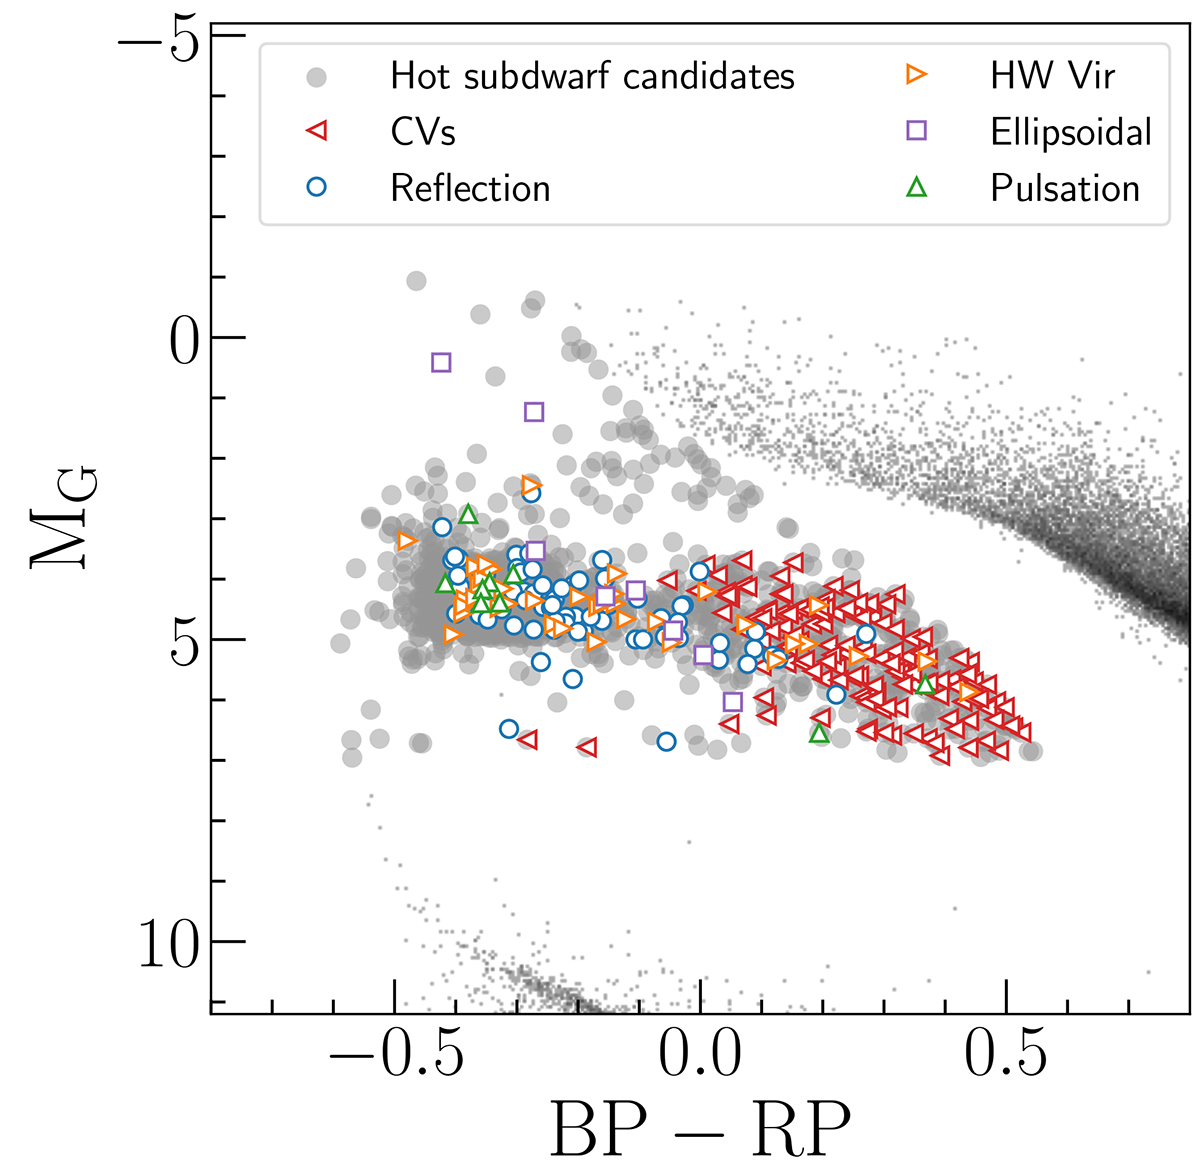
Fig. 7.
Download original image
Gaia DR3 colour-magnitude diagram depicting the candidate hot subdwarfs (1682) from Culpan et al. (2022) with Gaia light curves (grey circles). The variability classifications are shown for the selected candidate variable hot subdwarfs (290) with TESS observations (141/290). Among the candidate hot subdwarfs, CVs are also identified from the literature and are represented by left triangles. The grey background data points correspond to the Gaia Catalogue of Nearby Stars (Gaia Collaboration 2021b).
Current usage metrics show cumulative count of Article Views (full-text article views including HTML views, PDF and ePub downloads, according to the available data) and Abstracts Views on Vision4Press platform.
Data correspond to usage on the plateform after 2015. The current usage metrics is available 48-96 hours after online publication and is updated daily on week days.
Initial download of the metrics may take a while.