Fig. 1.
Download original image
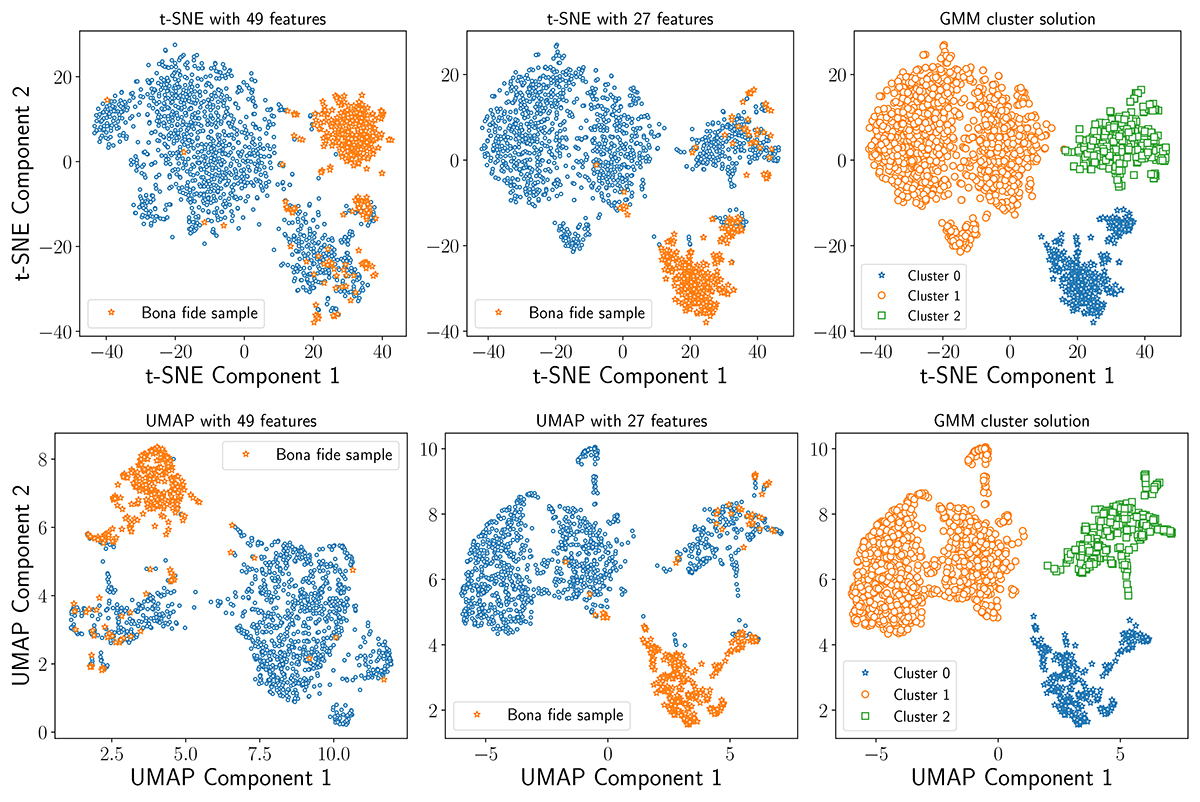
Clustering results using the t-SNE (top panels) and UMAP (bottom panels) dimensionality reduction algorithms and clustering labels (right panels) from the Gaussian mixture model (GMM). The left and middle panels represent the 2D components using 49 and 27 features, respectively. The open orange stars in these panels correspond to the manually selected objects with clear variabilities.
Current usage metrics show cumulative count of Article Views (full-text article views including HTML views, PDF and ePub downloads, according to the available data) and Abstracts Views on Vision4Press platform.
Data correspond to usage on the plateform after 2015. The current usage metrics is available 48-96 hours after online publication and is updated daily on week days.
Initial download of the metrics may take a while.