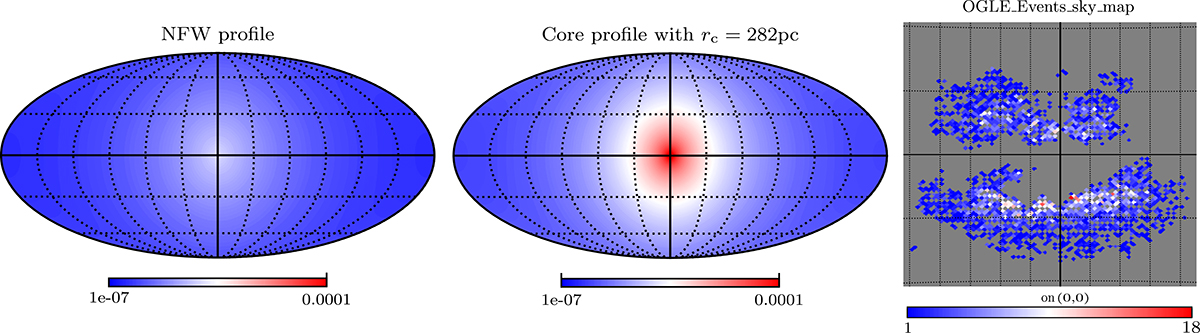
Fig. 1.
Download original image
Sky maps in a Mollweide projection. Left panel: Microlensing event rate in an NFW density profile. Middle panel: Event rate for a core of 282 pc. Right panel: sky map of 5790 OGLE microlensing events. The difference between the graticules are 2 deg in longitude and 4.5 deg in latitude. As we are unable to reach all the detailed data of the microlensing events that were used to build the catalog, we cannot plot an event-rate sky map (see Fig. 24 of Mróz et al. 2020).
Current usage metrics show cumulative count of Article Views (full-text article views including HTML views, PDF and ePub downloads, according to the available data) and Abstracts Views on Vision4Press platform.
Data correspond to usage on the plateform after 2015. The current usage metrics is available 48-96 hours after online publication and is updated daily on week days.
Initial download of the metrics may take a while.