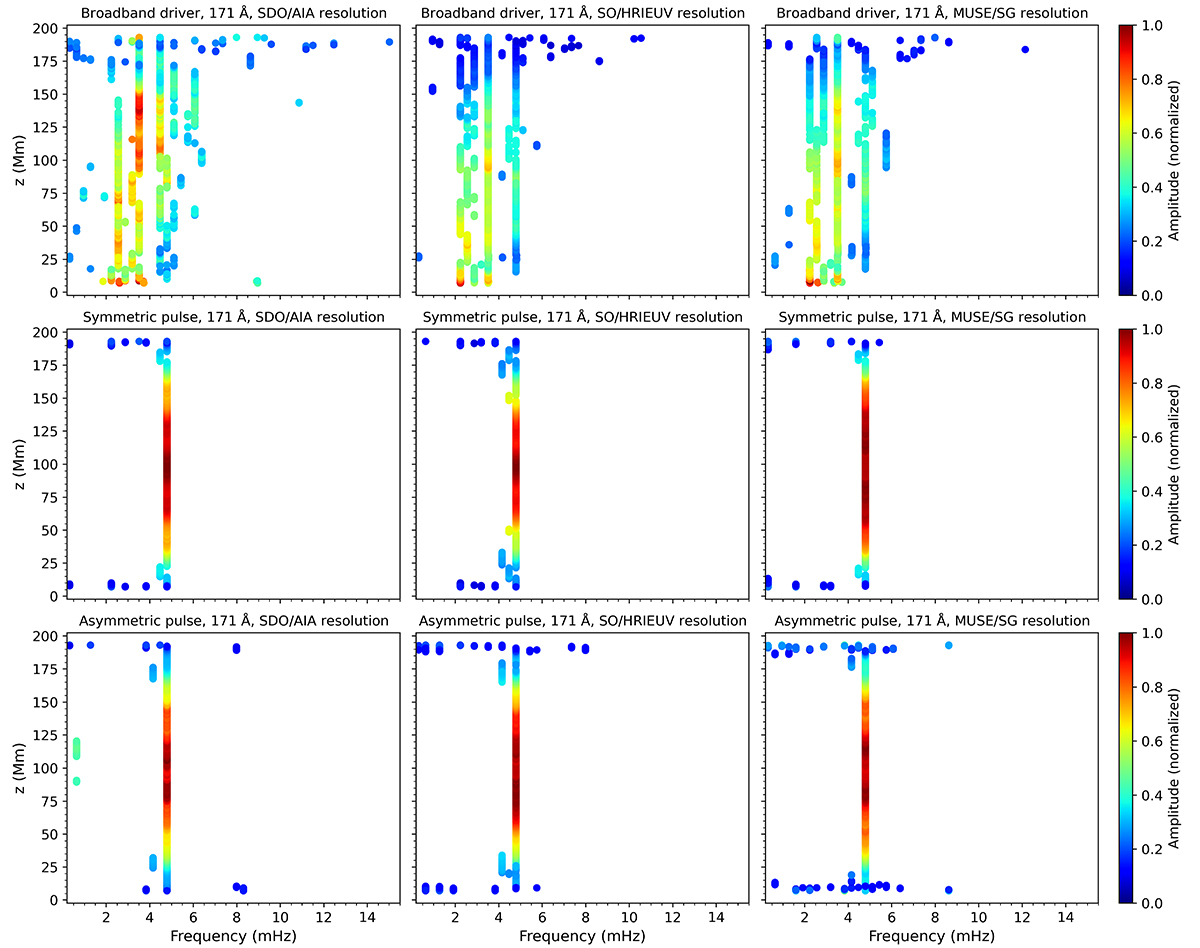
Fig. 5.
Download original image
Distribution of oscillation frequencies, detected with Auto-NUWT at each height, z, from the synthesised 171 Å line emissions. The colour bars correspond to the normalised amplitude of the oscillation for each detected frequency. As in Fig. 4, the left, middle, and right columns correspond to SDO/AIA, Solar Orbiter/HRIEUV, and MUSE/SG resolution, while the top, middle, and bottom panels correspond to the simulations with the broadband driver, symmetric pulse, and asymmetric pulse, respectively.
Current usage metrics show cumulative count of Article Views (full-text article views including HTML views, PDF and ePub downloads, according to the available data) and Abstracts Views on Vision4Press platform.
Data correspond to usage on the plateform after 2015. The current usage metrics is available 48-96 hours after online publication and is updated daily on week days.
Initial download of the metrics may take a while.