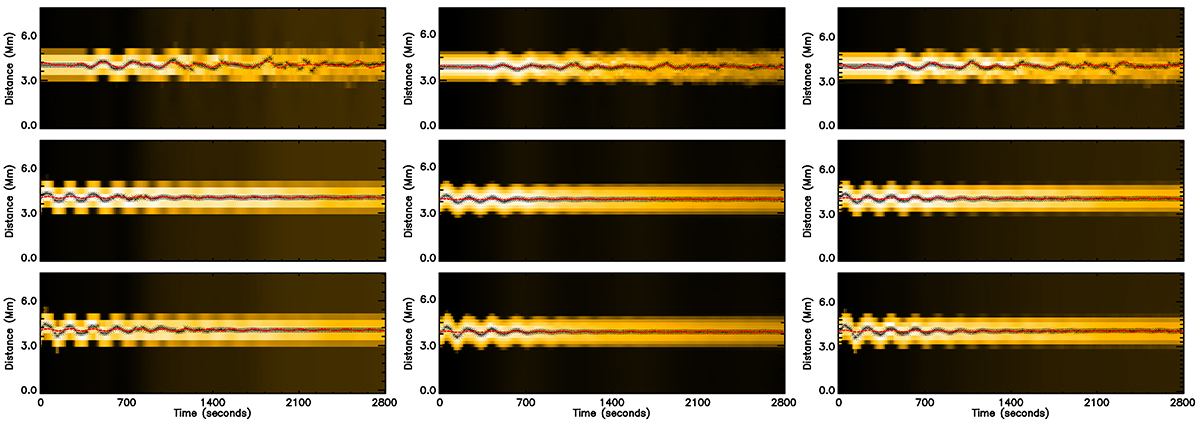
Fig. 4.
Download original image
Time-distance maps of the synthetic emission in the 171 Å line, for the three cases of oscillating loops, at the apex. Left column: SDO/AIA resolution. Middle column: Solar Orbiter/HRIEUV resolution. Right column: MUSE/SG resolution. Top panels: Loop with the broadband driver. Middle panels: Loop with the sinusoidal, symmetric pulse. Bottom panels: Asymmetric, off-centre Gaussian pulse. Overplotted in each panel are the oscillating signal of the loop centre (black asterisks) and a fitted sinusoidal function (solid red line) with the four prominent frequencies for each signal, as detected by Auto-NUWT.
Current usage metrics show cumulative count of Article Views (full-text article views including HTML views, PDF and ePub downloads, according to the available data) and Abstracts Views on Vision4Press platform.
Data correspond to usage on the plateform after 2015. The current usage metrics is available 48-96 hours after online publication and is updated daily on week days.
Initial download of the metrics may take a while.