Fig. 3.
Download original image
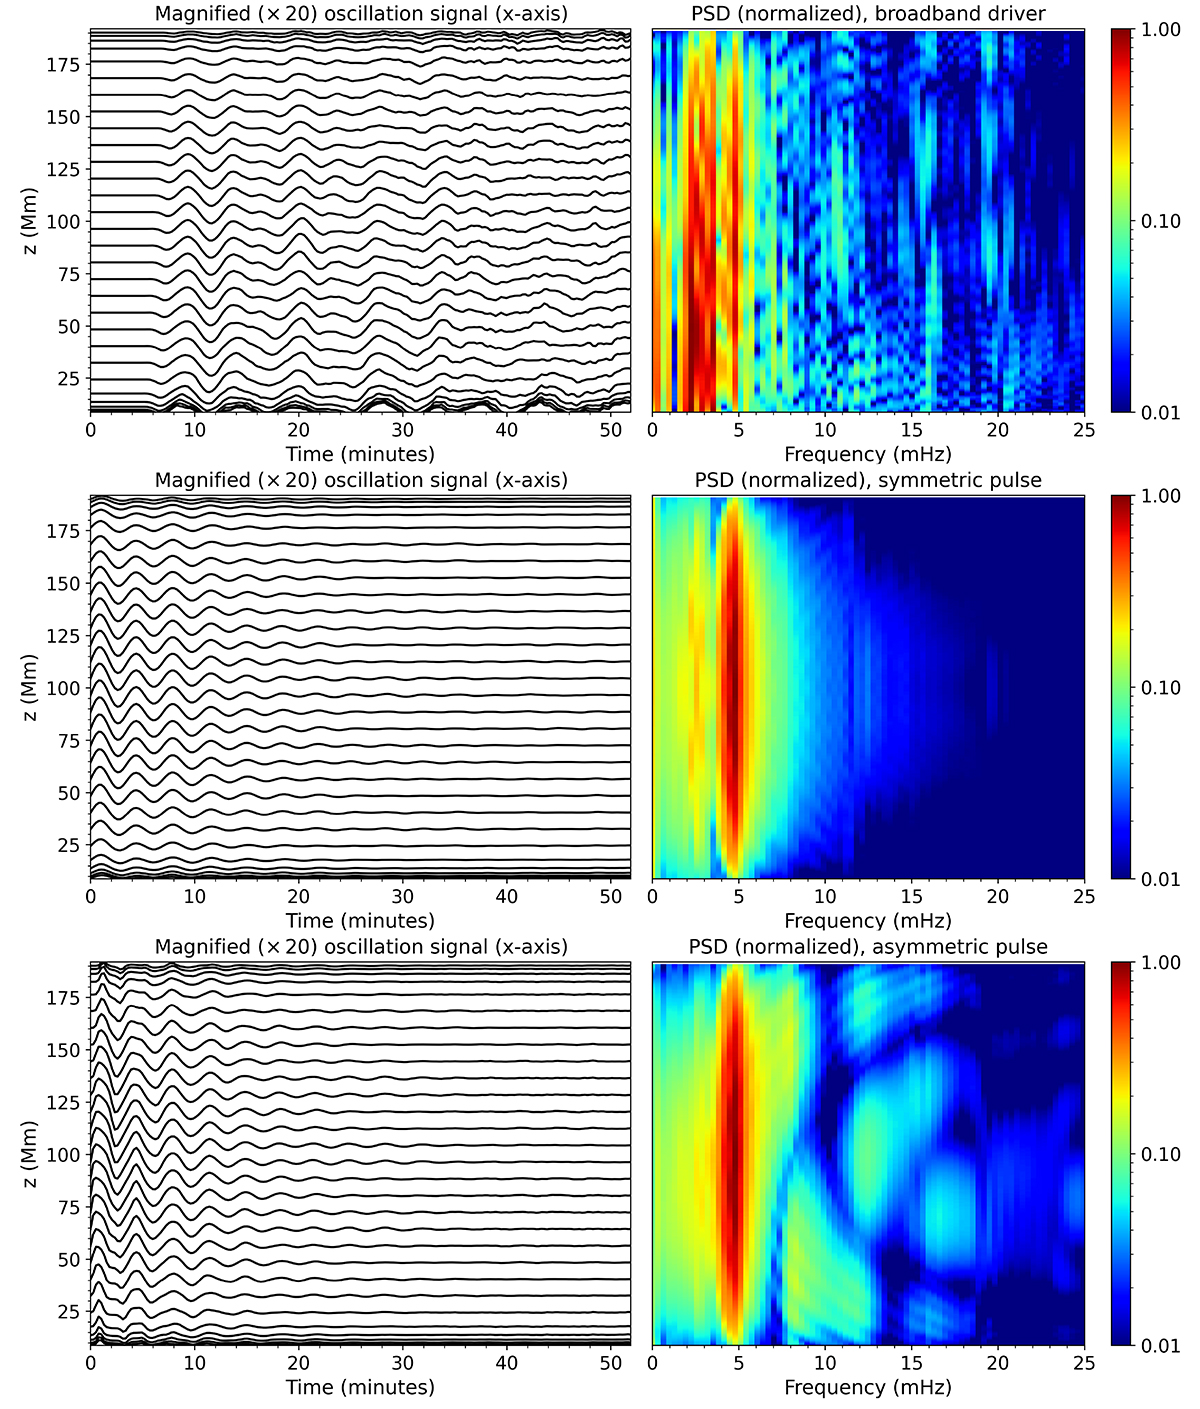
Centre of mass displacement (left panels) and corresponding power spectra density profiles (right panels) for the three simulations of our 3D loop. The time-distance maps of the displacement along the x-direction show the magnified (×20) signal projected along the z-axis for visualisation purposes. Only the coronal part of the loop is depicted. Shown are the simulations with the driver (top), with the symmetric initial pulse (middle), and with the asymmetric pulse (bottom).
Current usage metrics show cumulative count of Article Views (full-text article views including HTML views, PDF and ePub downloads, according to the available data) and Abstracts Views on Vision4Press platform.
Data correspond to usage on the plateform after 2015. The current usage metrics is available 48-96 hours after online publication and is updated daily on week days.
Initial download of the metrics may take a while.