Fig. 5
Download original image
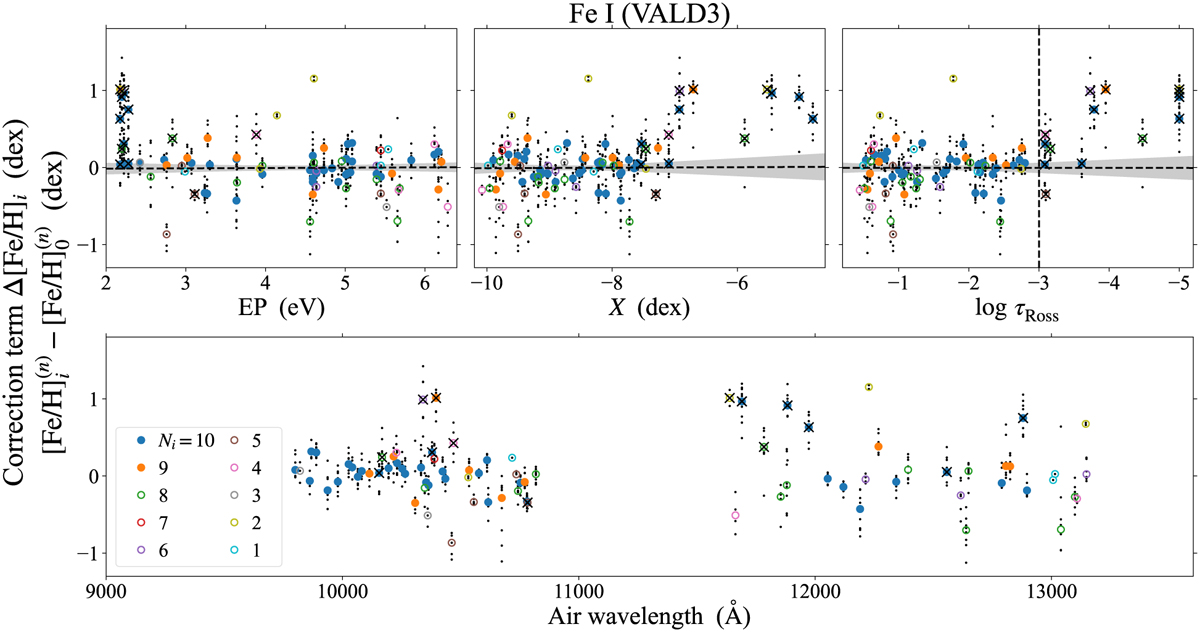
Correction term to the determined [Fe/H] values for each line for VALD3 as functions of EP (top-left panel), X index at 3850 K (top-middle), log τRoss (top-right), and wavelength in the standard air (bottom). Black dots show ![]() (see text). Circles show their mean values Δ[Fe/H]i among the sample stars, where the color of each circle indicates the number Ni of stars for which the corresponding line was successfully fitted. The lines indicated by open circles (i.e., Ni < 9; those in colors other than blue or orange) were excluded in the analysis. Circles overplotted by black crosses indicate the lines that do not satisfy the condition on the line strength (log τRoss > −3 indicated by the vertical black dashed line in the top right panel) and thus are not used in the analysis. Horizontal black dashed lines in the top panels indicate the linear regression between the values of the x and y axes for the lines marked with filled circles, together with the gray-shaded areas indicating the 1σ-confidence intervals.
(see text). Circles show their mean values Δ[Fe/H]i among the sample stars, where the color of each circle indicates the number Ni of stars for which the corresponding line was successfully fitted. The lines indicated by open circles (i.e., Ni < 9; those in colors other than blue or orange) were excluded in the analysis. Circles overplotted by black crosses indicate the lines that do not satisfy the condition on the line strength (log τRoss > −3 indicated by the vertical black dashed line in the top right panel) and thus are not used in the analysis. Horizontal black dashed lines in the top panels indicate the linear regression between the values of the x and y axes for the lines marked with filled circles, together with the gray-shaded areas indicating the 1σ-confidence intervals.
Current usage metrics show cumulative count of Article Views (full-text article views including HTML views, PDF and ePub downloads, according to the available data) and Abstracts Views on Vision4Press platform.
Data correspond to usage on the plateform after 2015. The current usage metrics is available 48-96 hours after online publication and is updated daily on week days.
Initial download of the metrics may take a while.