Fig. 4
Download original image
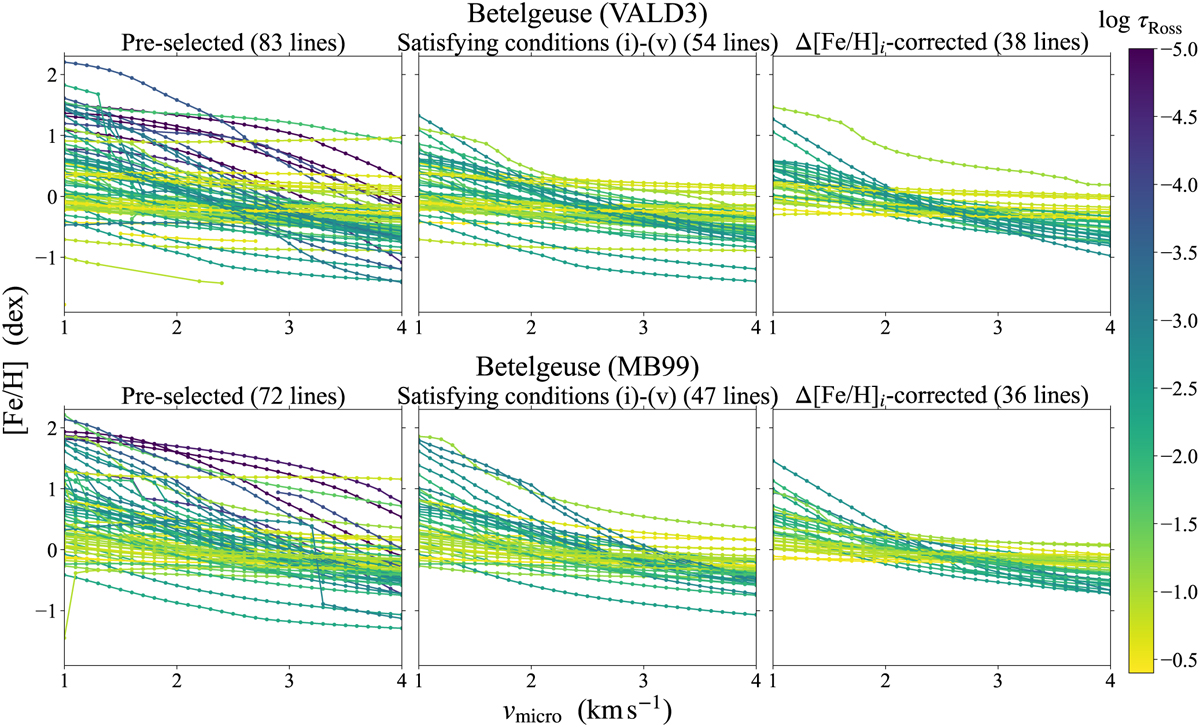
Examples of how [Fe/H] is determined from each absorption line as a function of vmicro : here for the case for Betelgeuse. Top and bottom panels show the results with VALD3 and MB99, respectively. Left panels show the measurements for all the Fe I lines preselected in Sect. 3.3, and middle panels do for the lines satisfying conditions (i)–(v) in the main text (Sect. 3.5.2) and eventually used. Right panels show the measurements after the correction term Δ[Fe/H]i defined in Eq. (8) subtracted. Each curve in the figures corresponds to each absorption line color-coded according to log τRoss of the line-forming layer of the line; a lighter color corresponds to a larger log τRoss and thus a smaller EW. The dot on each curve indicates the [Fe/H] value determined with the corresponding vmicro . No dots are plotted where the fitting for a line with a value of vmicro failed.
Current usage metrics show cumulative count of Article Views (full-text article views including HTML views, PDF and ePub downloads, according to the available data) and Abstracts Views on Vision4Press platform.
Data correspond to usage on the plateform after 2015. The current usage metrics is available 48-96 hours after online publication and is updated daily on week days.
Initial download of the metrics may take a while.