Fig. 3
Download original image
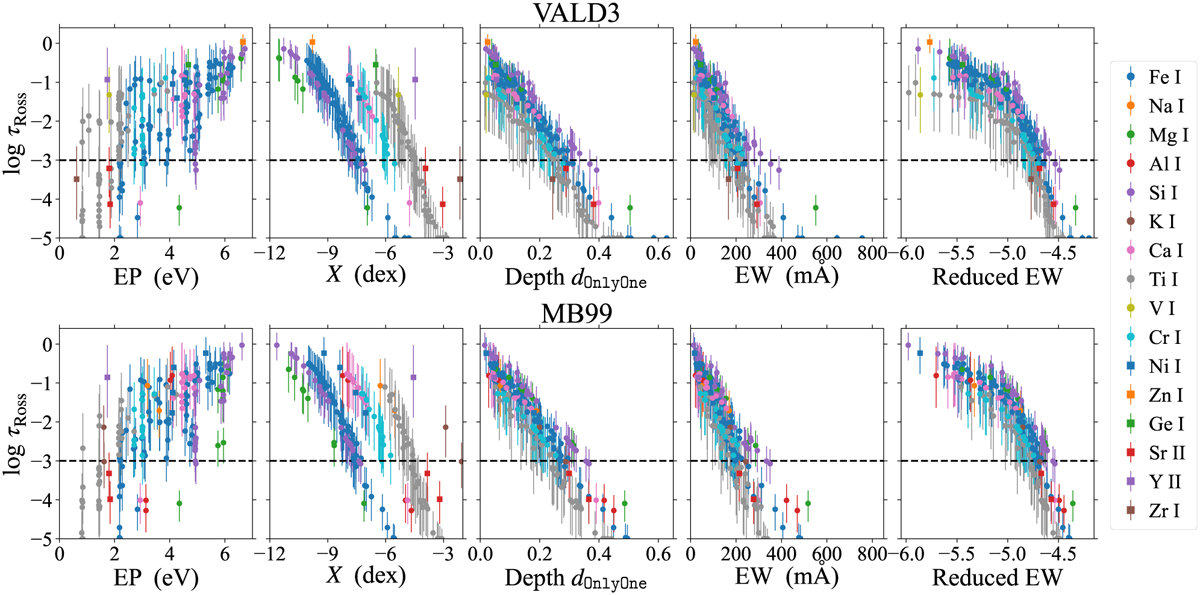
log τRoss of the line-forming layers of the lines preselected in Sect. 3.3 as functions of the EP, the X index at 3850 K, the model depth dOnlyOne , the model EW, and the reduced model EW. Top and bottom panels show the results with employed line lists of VALD3 and MB99, respectively. The vertical error bar represents the range of Rosseland-mean optical depth where the contribution function for the line is larger than the half of the maximum value at log τRoss. Horizontal black dashed line at log τRoss = −3.0 indicates the final criteria of our line selection.
Current usage metrics show cumulative count of Article Views (full-text article views including HTML views, PDF and ePub downloads, according to the available data) and Abstracts Views on Vision4Press platform.
Data correspond to usage on the plateform after 2015. The current usage metrics is available 48-96 hours after online publication and is updated daily on week days.
Initial download of the metrics may take a while.