Fig. 13
Download original image
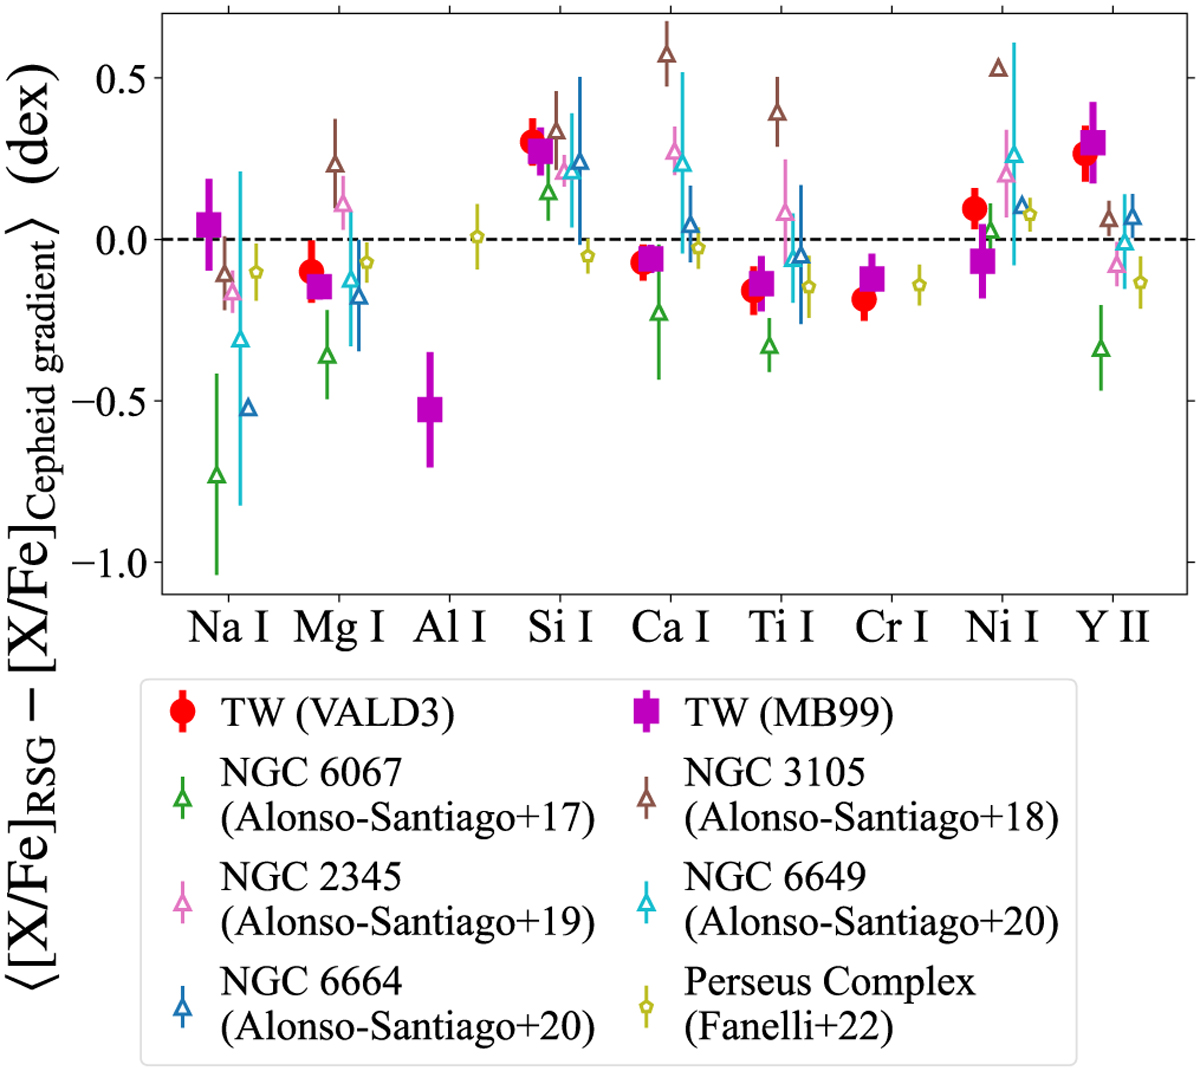
Chemical abundances of RSGs after subtracting the radial abundance gradients of Cepheids. Filled red circles and filled magenta squares show the weighted mean and standard error of the derived [X/Fe] of our targets RSGs for VALD3 and MB99, respectively, after subtracting the radial abundance gradients of Cepheids, which are tabulated in Table D.2 as Mean. Open symbols show those for RSGs by the works measuring [X/Fe] as well as [Fe/H] among those cited in Fig. 11: Alonso-Santiago et al. (2017, 2018, 2019, 2020) with green, brown, pink, and cyan/blue triangles, respectively, and Fanelli et al. (2022) with yellow pentagons. We note that we show the results for all the elements for which we determined the abundances of RSGs, except for [K/Fe], as the abundance for Cepheids were not measured by Luck (2018).
Current usage metrics show cumulative count of Article Views (full-text article views including HTML views, PDF and ePub downloads, according to the available data) and Abstracts Views on Vision4Press platform.
Data correspond to usage on the plateform after 2015. The current usage metrics is available 48-96 hours after online publication and is updated daily on week days.
Initial download of the metrics may take a while.