Fig. 10
Download original image
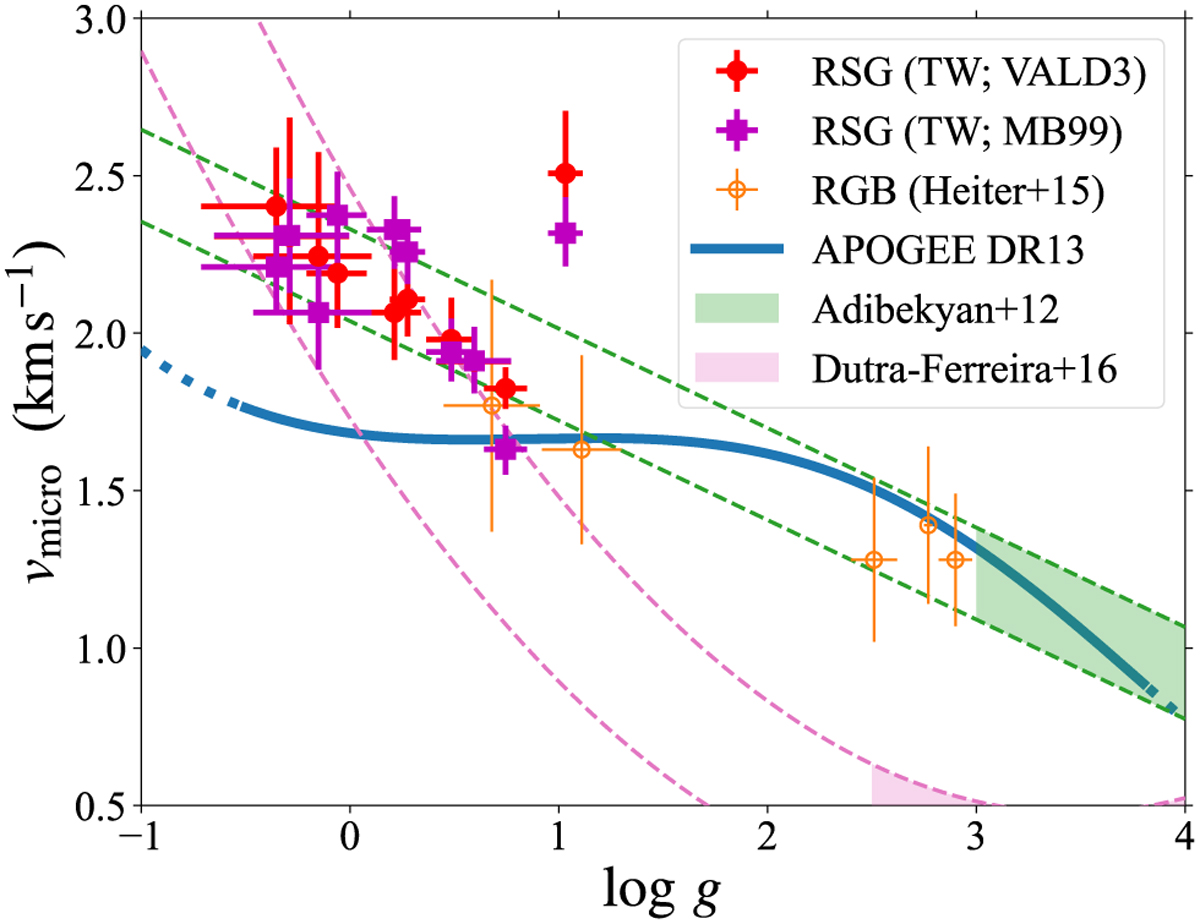
Relation between log g and vmicro . Red closed circles and magenta closed squares indicate the values that we determined for the target RSGs with VALD3 and MB99, respectively. Orange open circles indicate the values for the five solar-metallicity red giants among the Gaia FGK benchmark stars (Heiter et al. 2015) used in T21. Blue solid lines show the relation used in the ASPCAP code for APOGEE DR13 (Holtzman et al. 2018) for the log g ranges of their calibrating sample, with the extrapolated relation indicated by blue dotted lines. Green and pink dashed lines indicate the relations calibrated by Adibekyan et al. (2012) and Dutra-Ferreira et al. (2016), respectively, for Teff = 3500 and 4000 K, with the log g ranges of their calibrating samples indicated by shades in the respective colors.
Current usage metrics show cumulative count of Article Views (full-text article views including HTML views, PDF and ePub downloads, according to the available data) and Abstracts Views on Vision4Press platform.
Data correspond to usage on the plateform after 2015. The current usage metrics is available 48-96 hours after online publication and is updated daily on week days.
Initial download of the metrics may take a while.