Fig. 3
Download original image
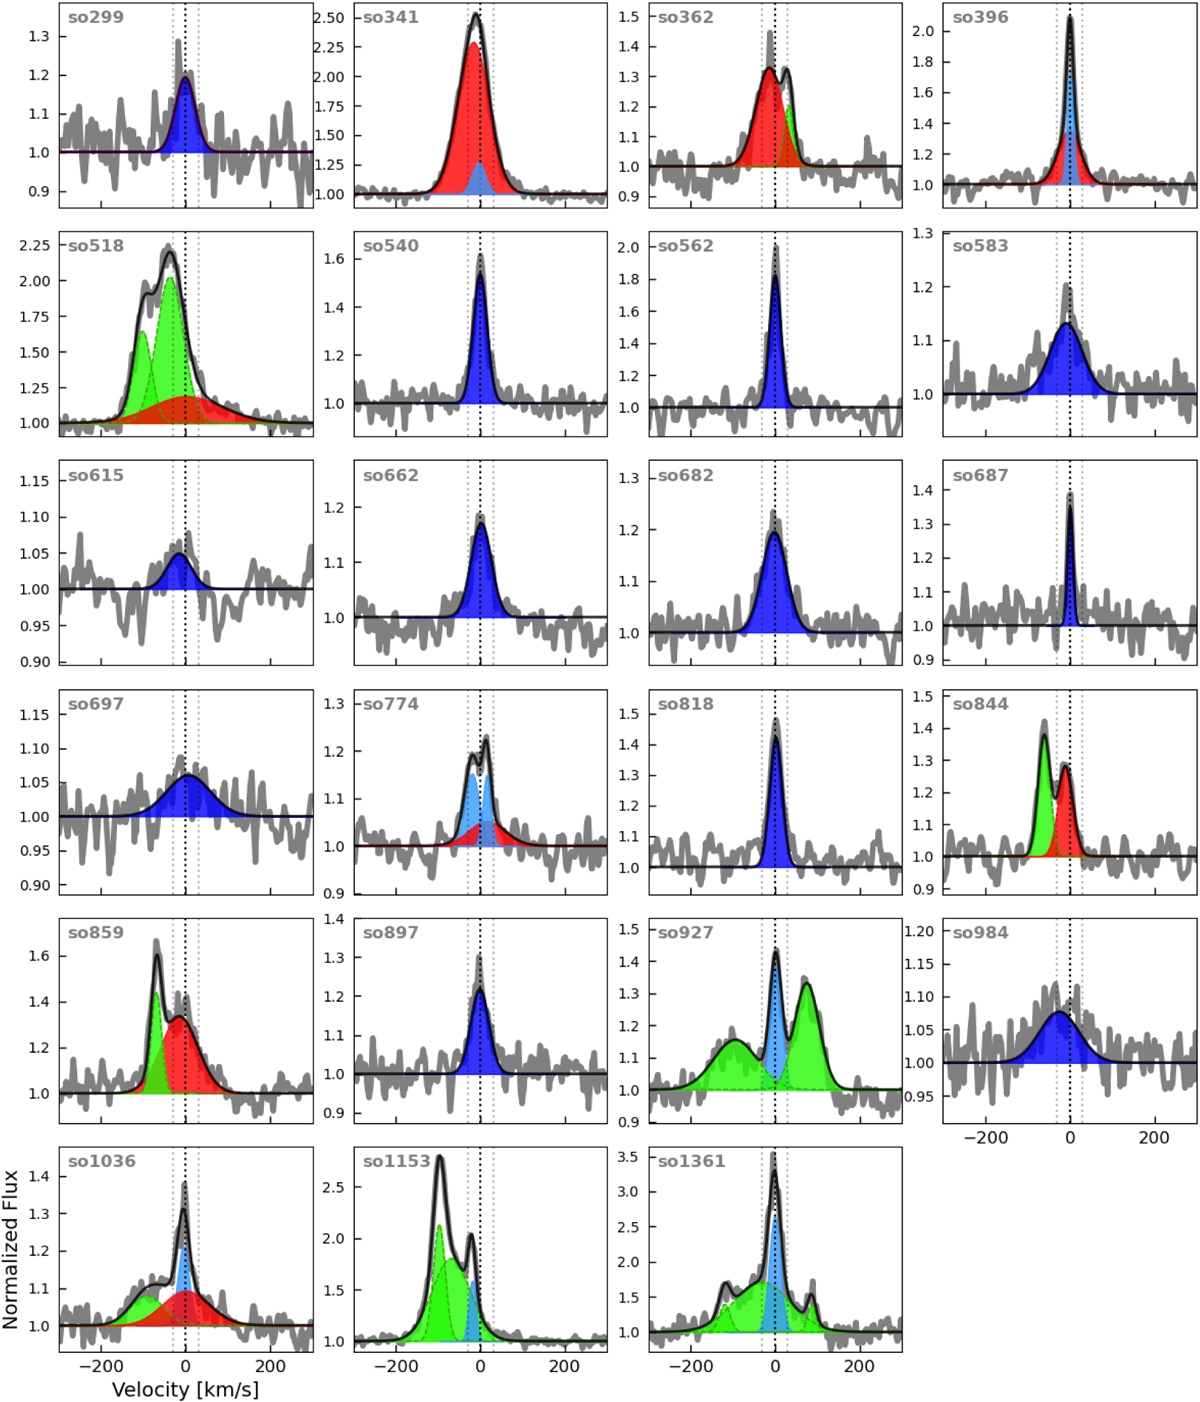
[OI] λ6300 lines’ fit profiles for the MIKE spectra. The colors indicate the type of Gaussian component as described in Sect. 4.2: single component (dark blue), low-velocity narrow component (light blue), low-velocity broad component (red), high-velocity component (green). The black dotted line is located at 0 km/s, while the gray dotted lines indicate the velocity threshold for the high/low-velocity component (±30 km/s).
Current usage metrics show cumulative count of Article Views (full-text article views including HTML views, PDF and ePub downloads, according to the available data) and Abstracts Views on Vision4Press platform.
Data correspond to usage on the plateform after 2015. The current usage metrics is available 48-96 hours after online publication and is updated daily on week days.
Initial download of the metrics may take a while.