Fig. 10
Download original image
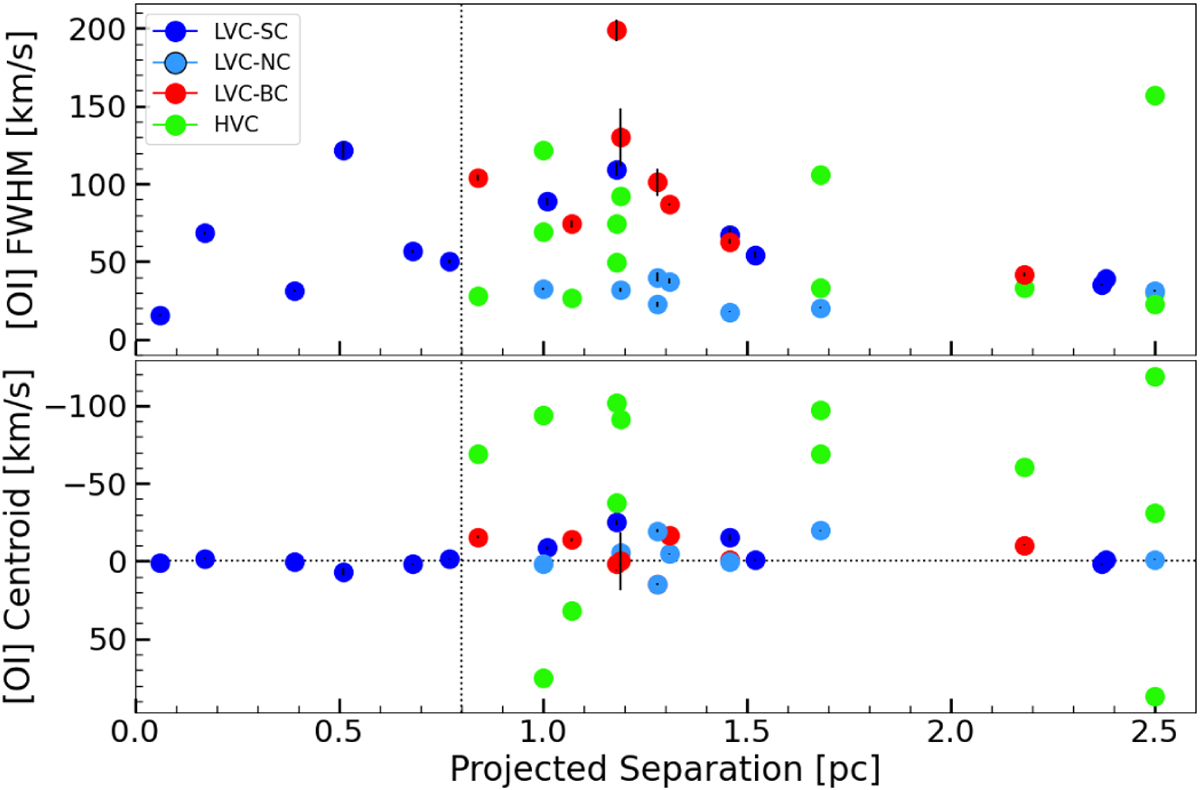
[OI] λ6300 lines FWHM (top) and peak velocity (bottom) as a function of projected separation from σ-Ori for MIKE sources. The colors represent the type of Gaussian components as explained in Sect. 4.2. The vertical dotted line is positioned at 0.8 pc (see text for details). The horizontal line indicates the systemic stellar velocity (0 km/s).
Current usage metrics show cumulative count of Article Views (full-text article views including HTML views, PDF and ePub downloads, according to the available data) and Abstracts Views on Vision4Press platform.
Data correspond to usage on the plateform after 2015. The current usage metrics is available 48-96 hours after online publication and is updated daily on week days.
Initial download of the metrics may take a while.