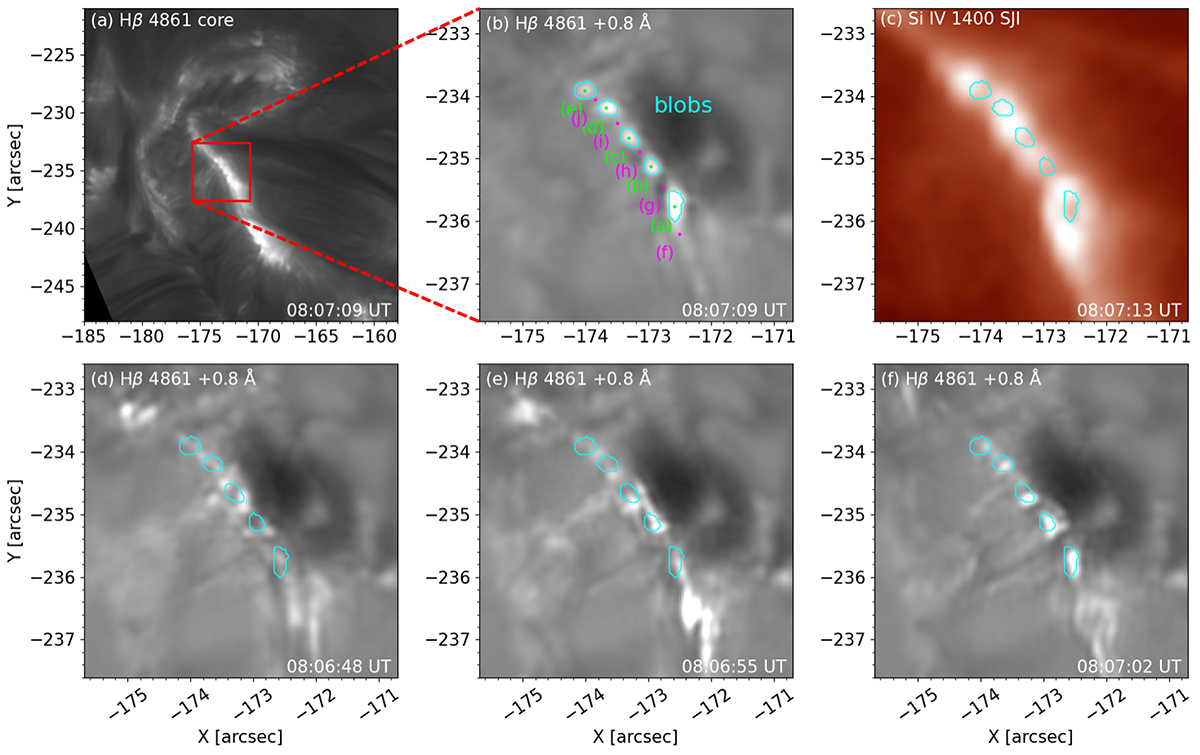
Fig. 5.
Download original image
Eastern ribbon during the impulsive phase in the highest spatial resolution. Panel (a) shows the full ribbon in Hβ core and the red rectangle outlines the region that is shown at a larger magnification in panels (b)–(f). Panel (b) shows an image in Hβ +0.8 Å where the blobs are evident and panel (c) shows the Si IV 1400 SJI channel. Panels (d)–(f) show Hβ +0.8 Å at different times before 08:07:09 UT. Cyan contours in panels (b)–(f) outline the blobs from panel (b) as detected by the FWHM method. The green and magenta dots mark the locations of the blobs and regions between the blobs that are used for spectral profile analysis. This figure is associated with an animation that is available online.
Current usage metrics show cumulative count of Article Views (full-text article views including HTML views, PDF and ePub downloads, according to the available data) and Abstracts Views on Vision4Press platform.
Data correspond to usage on the plateform after 2015. The current usage metrics is available 48-96 hours after online publication and is updated daily on week days.
Initial download of the metrics may take a while.