Fig. 4.
Download original image
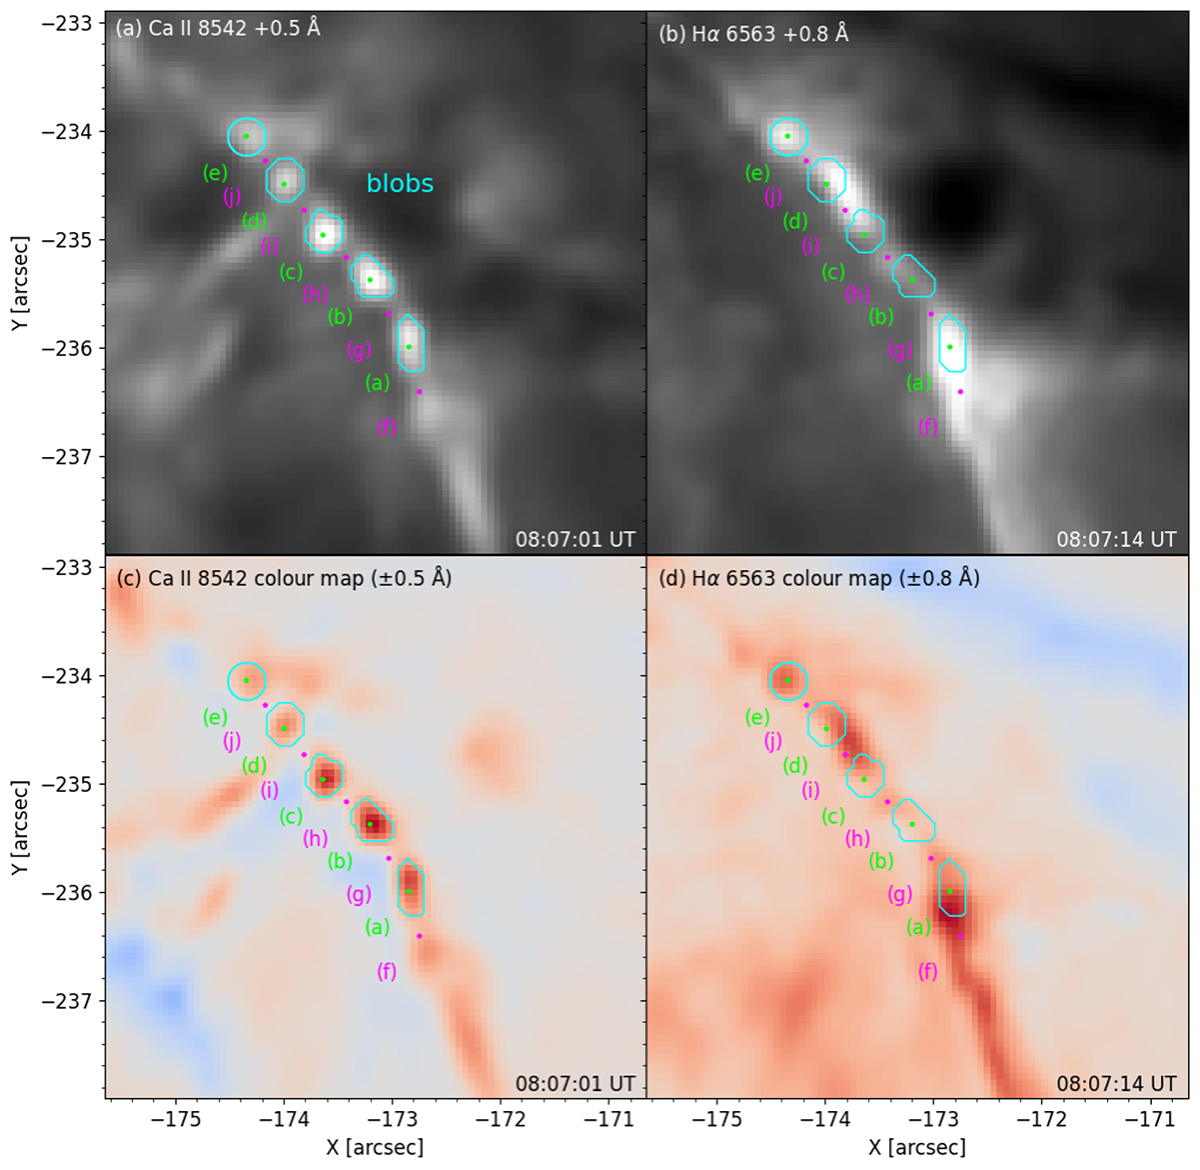
Fine-scale features in the straight part of the eastern ribbon as outlined by the cyan rectangle in Fig. 3e. Upper row: CRISP images in the Ca II 8542 Å and Hα red wings. Bottom row: Colour maps computed by subtracting the wing intensities at the spectral positions shown in the titles. Both colour maps are saturated symmetrically around 0 so that pixels in white show no excess emission in either red or blue. Cyan contours in all panels outline bright features from panel (a). Contours surrounding pixel (a)–(d) were detected by the FWHM method, while the contour surrounding pixel (e) was manually selected. The green pixels highlight the centre of the blobs and the magenta pixels are located in regions between the blobs. Pixel (f) is selected below the lower-most blob in a region where brightening is evident for Ca II 8542 Å and Hα. All pixels are labelled with a letter a–j that corresponds to the panel titles in Figs. 7 and 8.
Current usage metrics show cumulative count of Article Views (full-text article views including HTML views, PDF and ePub downloads, according to the available data) and Abstracts Views on Vision4Press platform.
Data correspond to usage on the plateform after 2015. The current usage metrics is available 48-96 hours after online publication and is updated daily on week days.
Initial download of the metrics may take a while.