Fig. 3.

Download original image
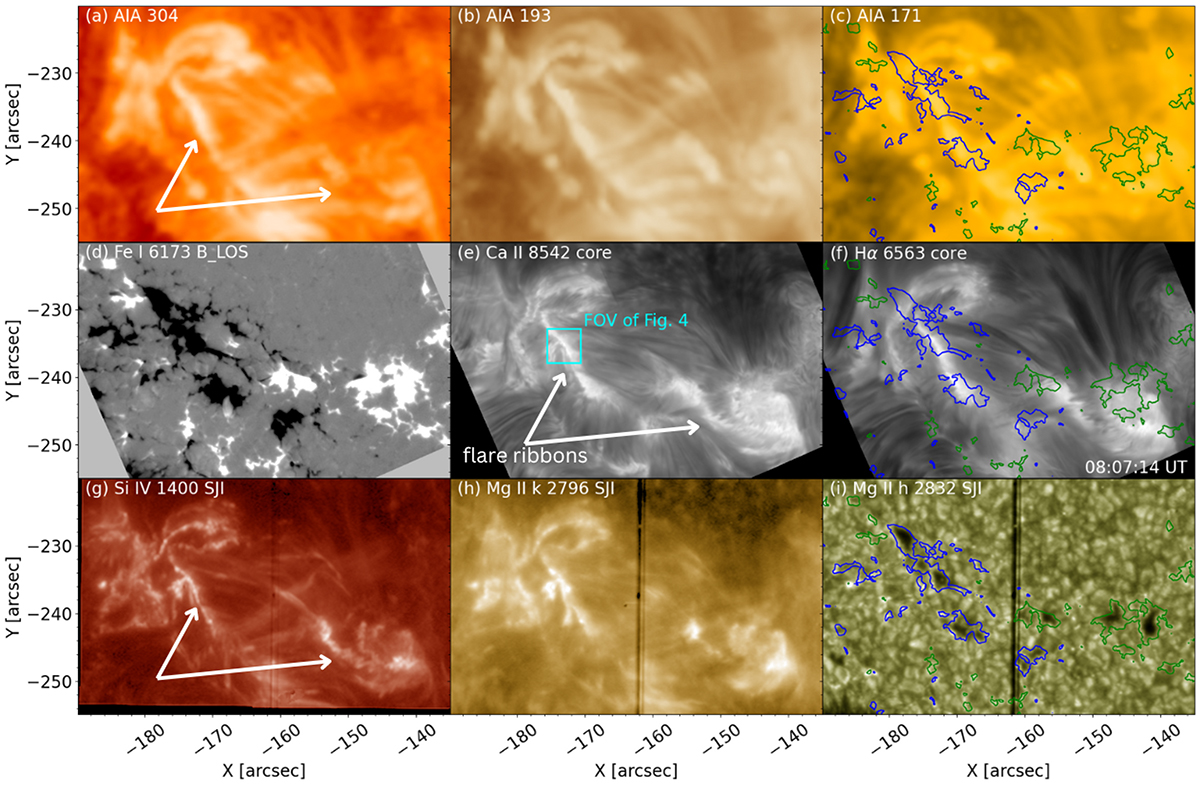
Flare ribbon observation in different channels at 08:07 UT. Top row: (a) AIA 304 Å, (b) AIA 193 Å and (c) AIA 171 Å channels. Second row: (d) line-of-sight magnetic field from Fe I 6173 Å line saturated at ±500 G, (e) Ca II 8542 Å core and (f) Hα core from CRISP. Bottom row: Si IV 1400 Å SJI, Mg II k 2796 Å SJI and Mg II h 2832 Å SJI from the IRIS telescope. White arrows in panels (a), (e) and (g) point to the location of the flare ribbons. The magnetic field from the SST magnetogram is shown as contours in green and blue at ±500 G. The cyan rectangle in panel (e) corresponds to the FOV, where fine-scale structures are studied. The dark vertical line in the middle of the IRIS images is the spectrograph slit. This figure is associated with an animation that is available online.
Current usage metrics show cumulative count of Article Views (full-text article views including HTML views, PDF and ePub downloads, according to the available data) and Abstracts Views on Vision4Press platform.
Data correspond to usage on the plateform after 2015. The current usage metrics is available 48-96 hours after online publication and is updated daily on week days.
Initial download of the metrics may take a while.


