Fig. 1.
Download original image
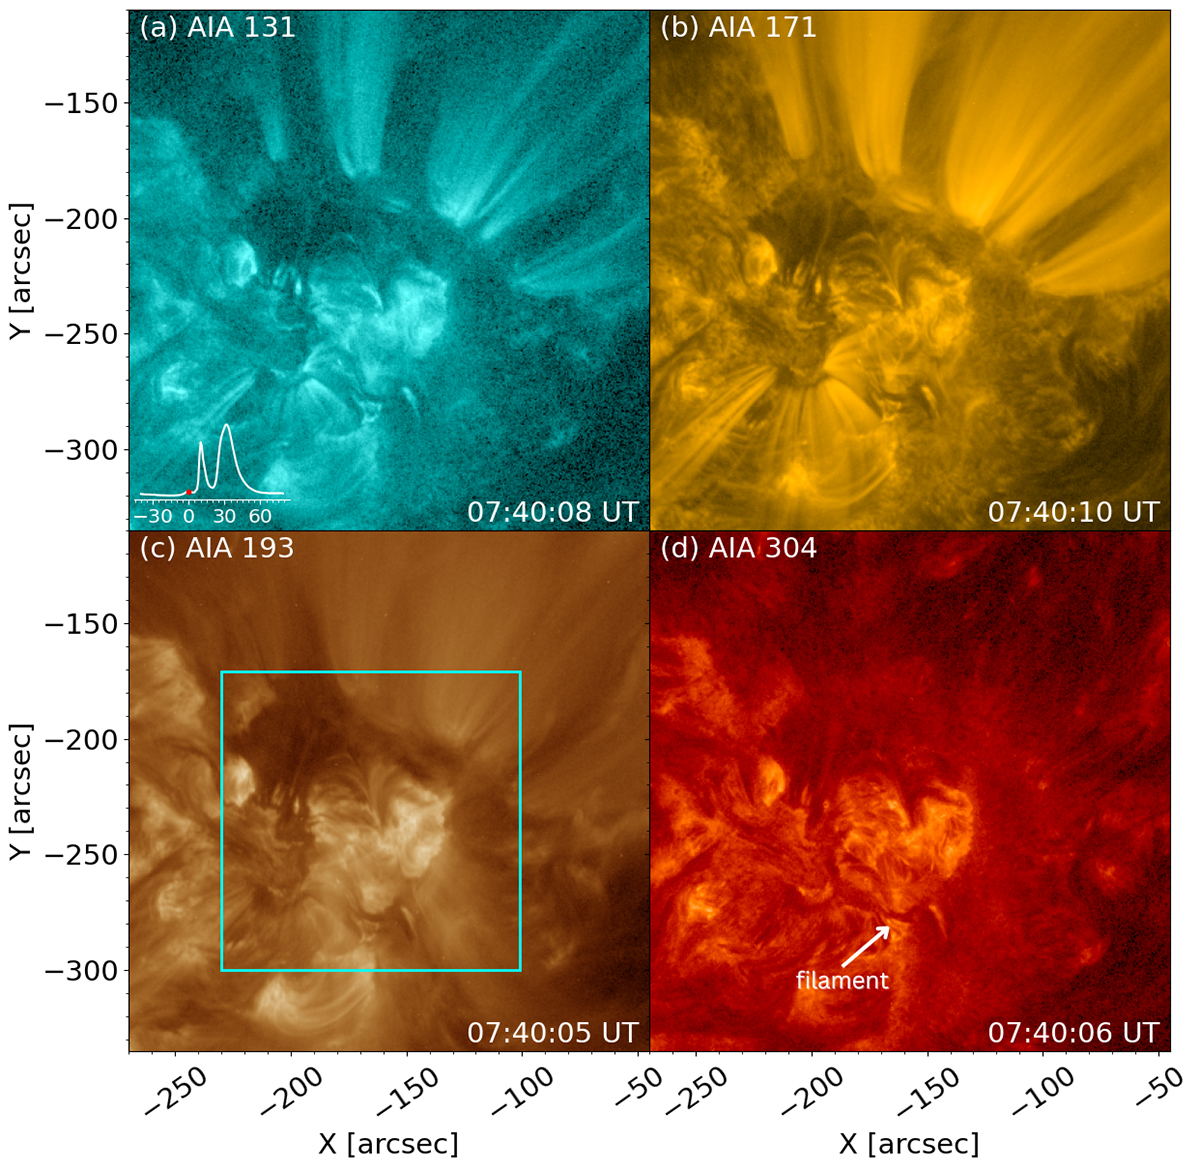
Context images of NOAA AR 13040 on June 26, 2022, at 07:40 UT in different AIA channels. The GOES X-ray plot is superimposed in the lower left corner in panel (a), where the red dot represents the time of the AIA images. The cyan rectangle in panel (c) marks the FOV shown in Fig. 2. The white arrow in panel (d) points to the erupting filament. This figure is associated with an animation that shows the full evolution of the filament eruption.
Fig. 2.
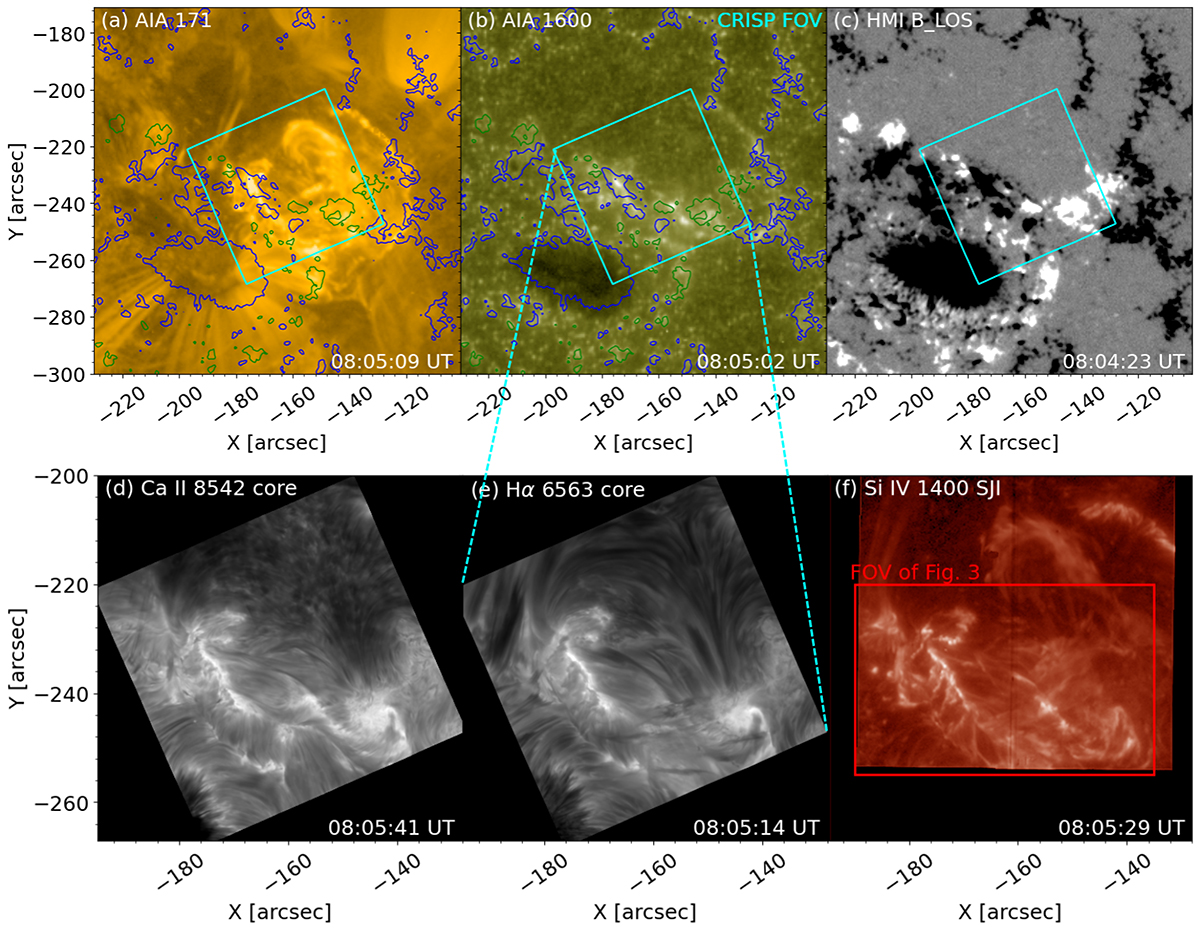
Impulsive phase of the GOES C2.4 flare 5 min before the peak time. The larger FOV in the first row shows the global view of the flaring region in AIA and HMI observations. The pointing FOV of CRISP is overplotted in panels (a)–(c) as cyan rectangles. The magnetic field from HMI is shown as contours at ±200 G in panels (a) and (b), where green (blue) indicates positive (negative) polarity. Panel (d) and (e) show the full FOV from CRISP in the Ca II 8542 Å line core and Hα line core, respectively. Panel (f) shows the aligned IRIS FOV in the Si IV 1400 Å channel. The red rectangle in panel (f) shows the FOV as shown in Fig. 3.
Current usage metrics show cumulative count of Article Views (full-text article views including HTML views, PDF and ePub downloads, according to the available data) and Abstracts Views on Vision4Press platform.
Data correspond to usage on the plateform after 2015. The current usage metrics is available 48-96 hours after online publication and is updated daily on week days.
Initial download of the metrics may take a while.