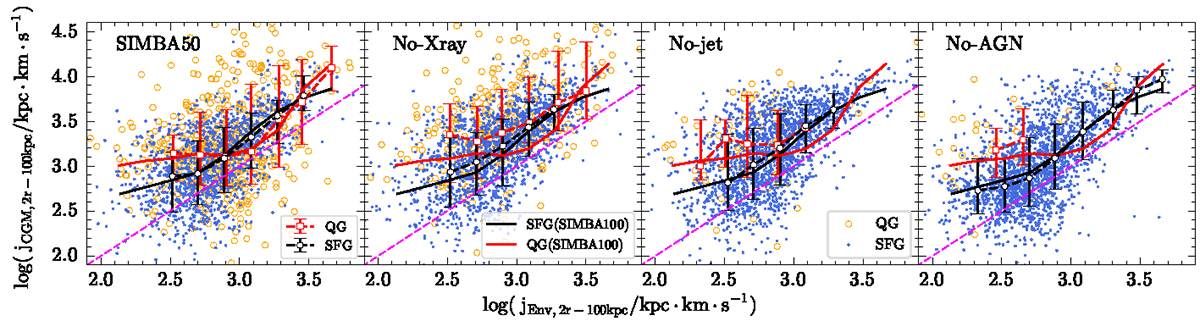
Fig. 7.
Download original image
Same as Fig. 6, but for the fiducial SIMBA50 run, No-Xray run, No-jet run, and No-AGN run, respectively. The black and red dashed lines show the relations of SFGs and QGs in SIMBA50, respectively. To clearly illustrate the effect of feedback, we replicate in each panel the medians for SFGs and QGs in SIMBA100 with black and red solid lines, respectively.
Current usage metrics show cumulative count of Article Views (full-text article views including HTML views, PDF and ePub downloads, according to the available data) and Abstracts Views on Vision4Press platform.
Data correspond to usage on the plateform after 2015. The current usage metrics is available 48-96 hours after online publication and is updated daily on week days.
Initial download of the metrics may take a while.