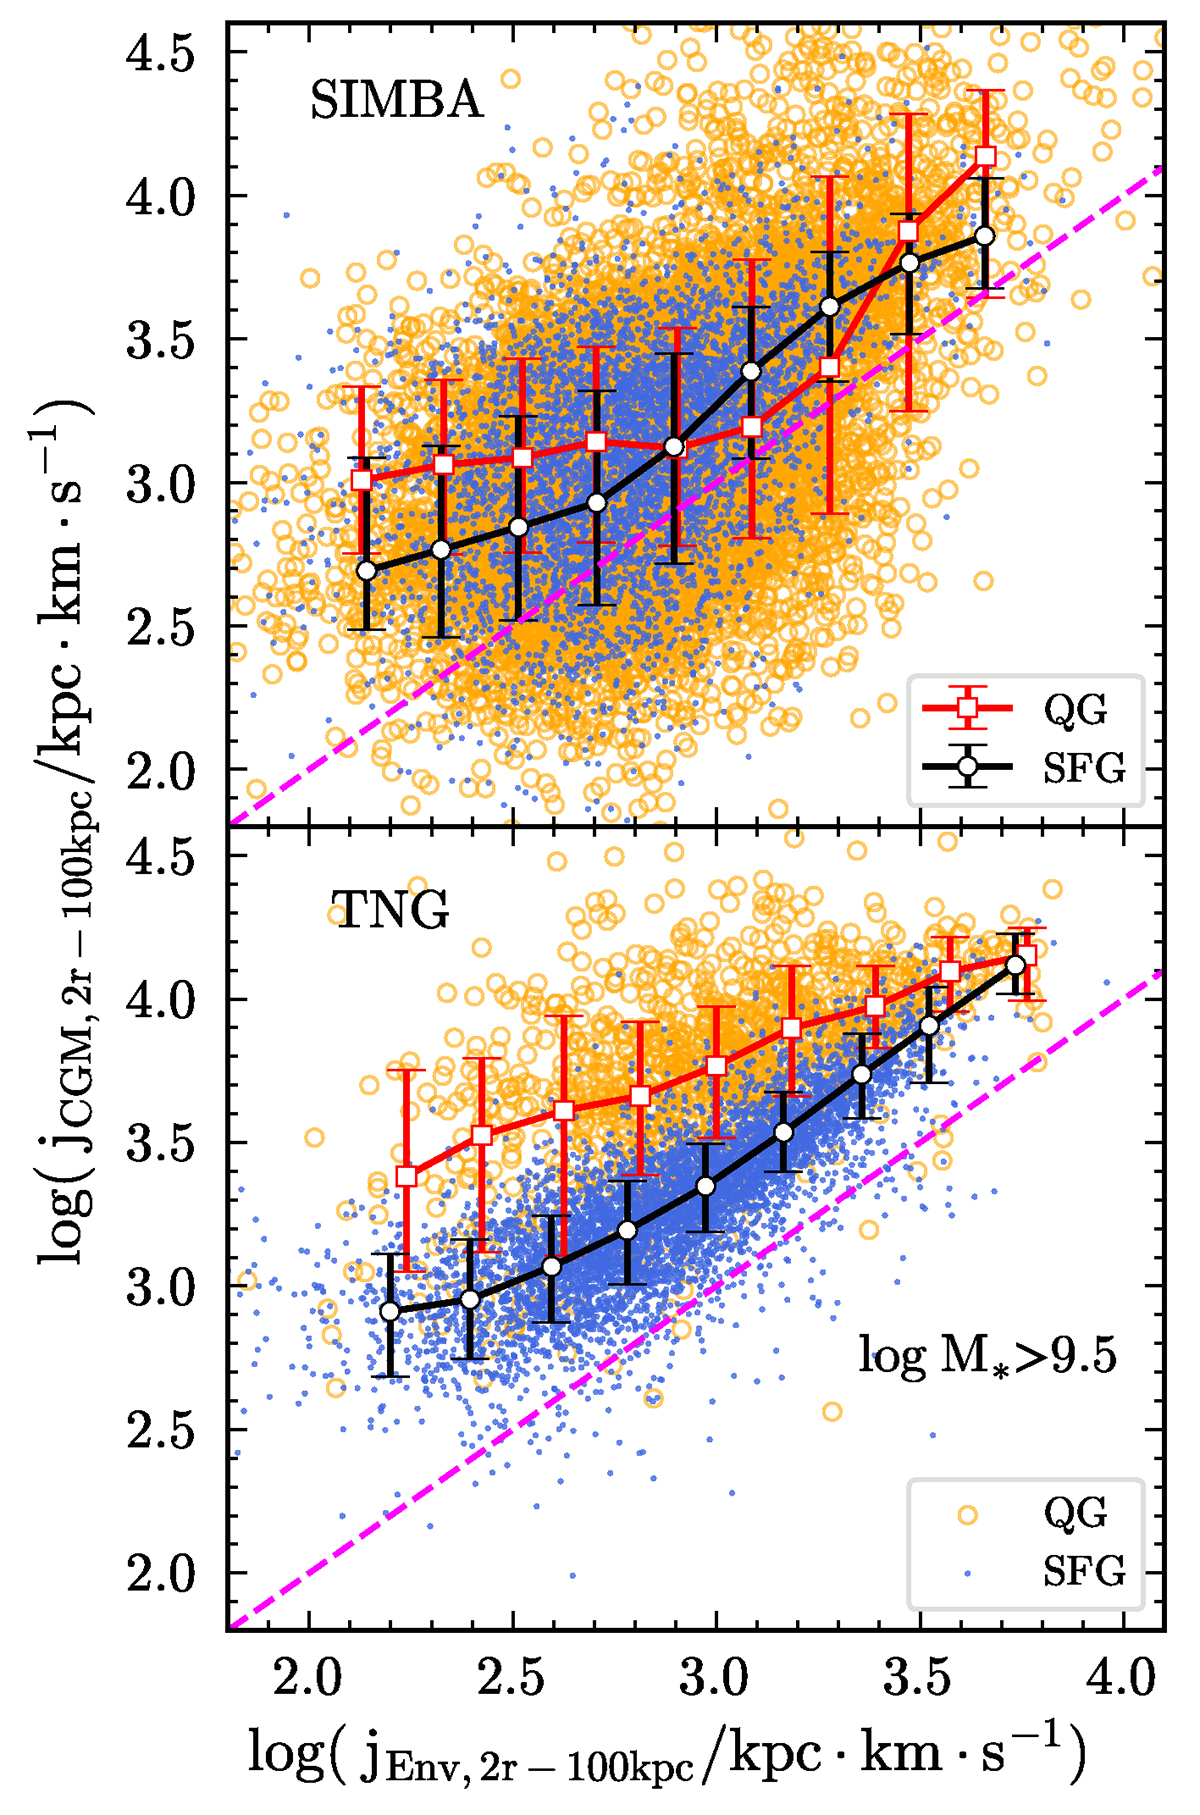
Fig. 6.
Download original image
Relations between jCGM and jEnv within 2Rhsm to 100 kpc, for SIMBA and TNG, from top to bottom, respectively. The black line is the relation of SFGs and red line is the relation of QGs in each panel. To show the trend more clearly, we present 1:1 baselines, indicated by the magenta dotted lines. For SFGs and QGs, each sample is plotted with a blue dot and an orange circle, respectively. Each line shows the median values, with errors estimated from the 16th − 84th percentile ranges.
Current usage metrics show cumulative count of Article Views (full-text article views including HTML views, PDF and ePub downloads, according to the available data) and Abstracts Views on Vision4Press platform.
Data correspond to usage on the plateform after 2015. The current usage metrics is available 48-96 hours after online publication and is updated daily on week days.
Initial download of the metrics may take a while.