Fig. 5.
Download original image
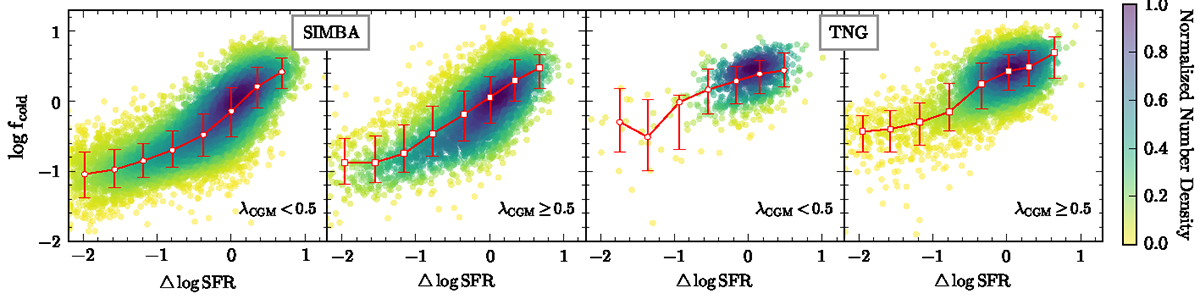
Relations between log fcold and ΔlogSFR, for TNG and SIMBA, from left to right, respectively. The coloured background is the probability density distribution, as described in Figure 2. The solid red line is plotted by median values with errors estimated from the 16th − 84th percentile ranges, and is simply distinguished by high and low spin.
Current usage metrics show cumulative count of Article Views (full-text article views including HTML views, PDF and ePub downloads, according to the available data) and Abstracts Views on Vision4Press platform.
Data correspond to usage on the plateform after 2015. The current usage metrics is available 48-96 hours after online publication and is updated daily on week days.
Initial download of the metrics may take a while.