Fig. 4.
Download original image
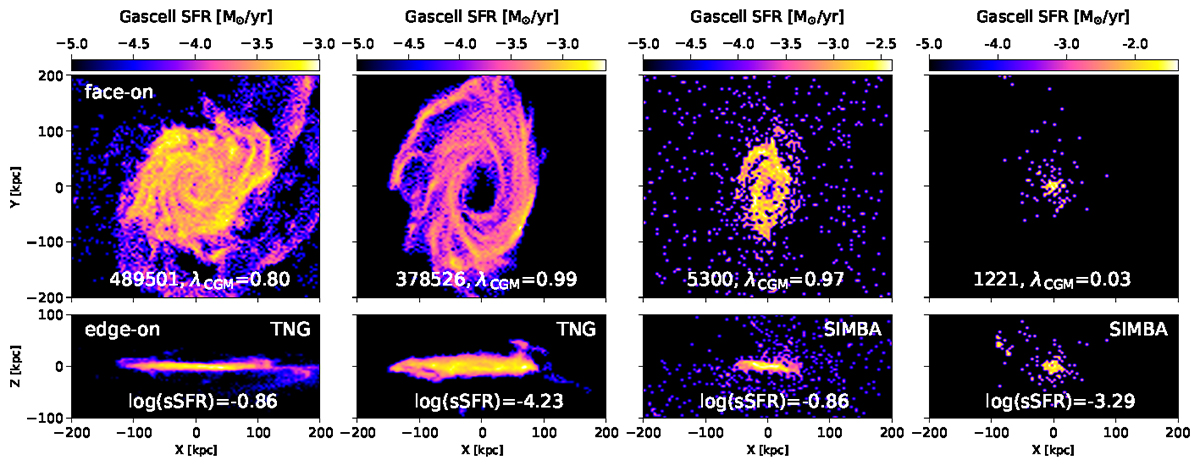
Spatial distribution of cold gas in four examples of TNG and SIMBA, respectively. Stellar masses of all four galaxies are in the range of 1010.2 − 1010.8 M⊙. Top panels are shown in face-on projection, along with the direction of galaxy gas angular momentum, and bottom is in edge-on projection. The gas distribution is colour-coded by its star-formation rate, and λCGM and log sSFR (M⊙/Gyr) are labelled in each panel.
Current usage metrics show cumulative count of Article Views (full-text article views including HTML views, PDF and ePub downloads, according to the available data) and Abstracts Views on Vision4Press platform.
Data correspond to usage on the plateform after 2015. The current usage metrics is available 48-96 hours after online publication and is updated daily on week days.
Initial download of the metrics may take a while.