Fig. 2.
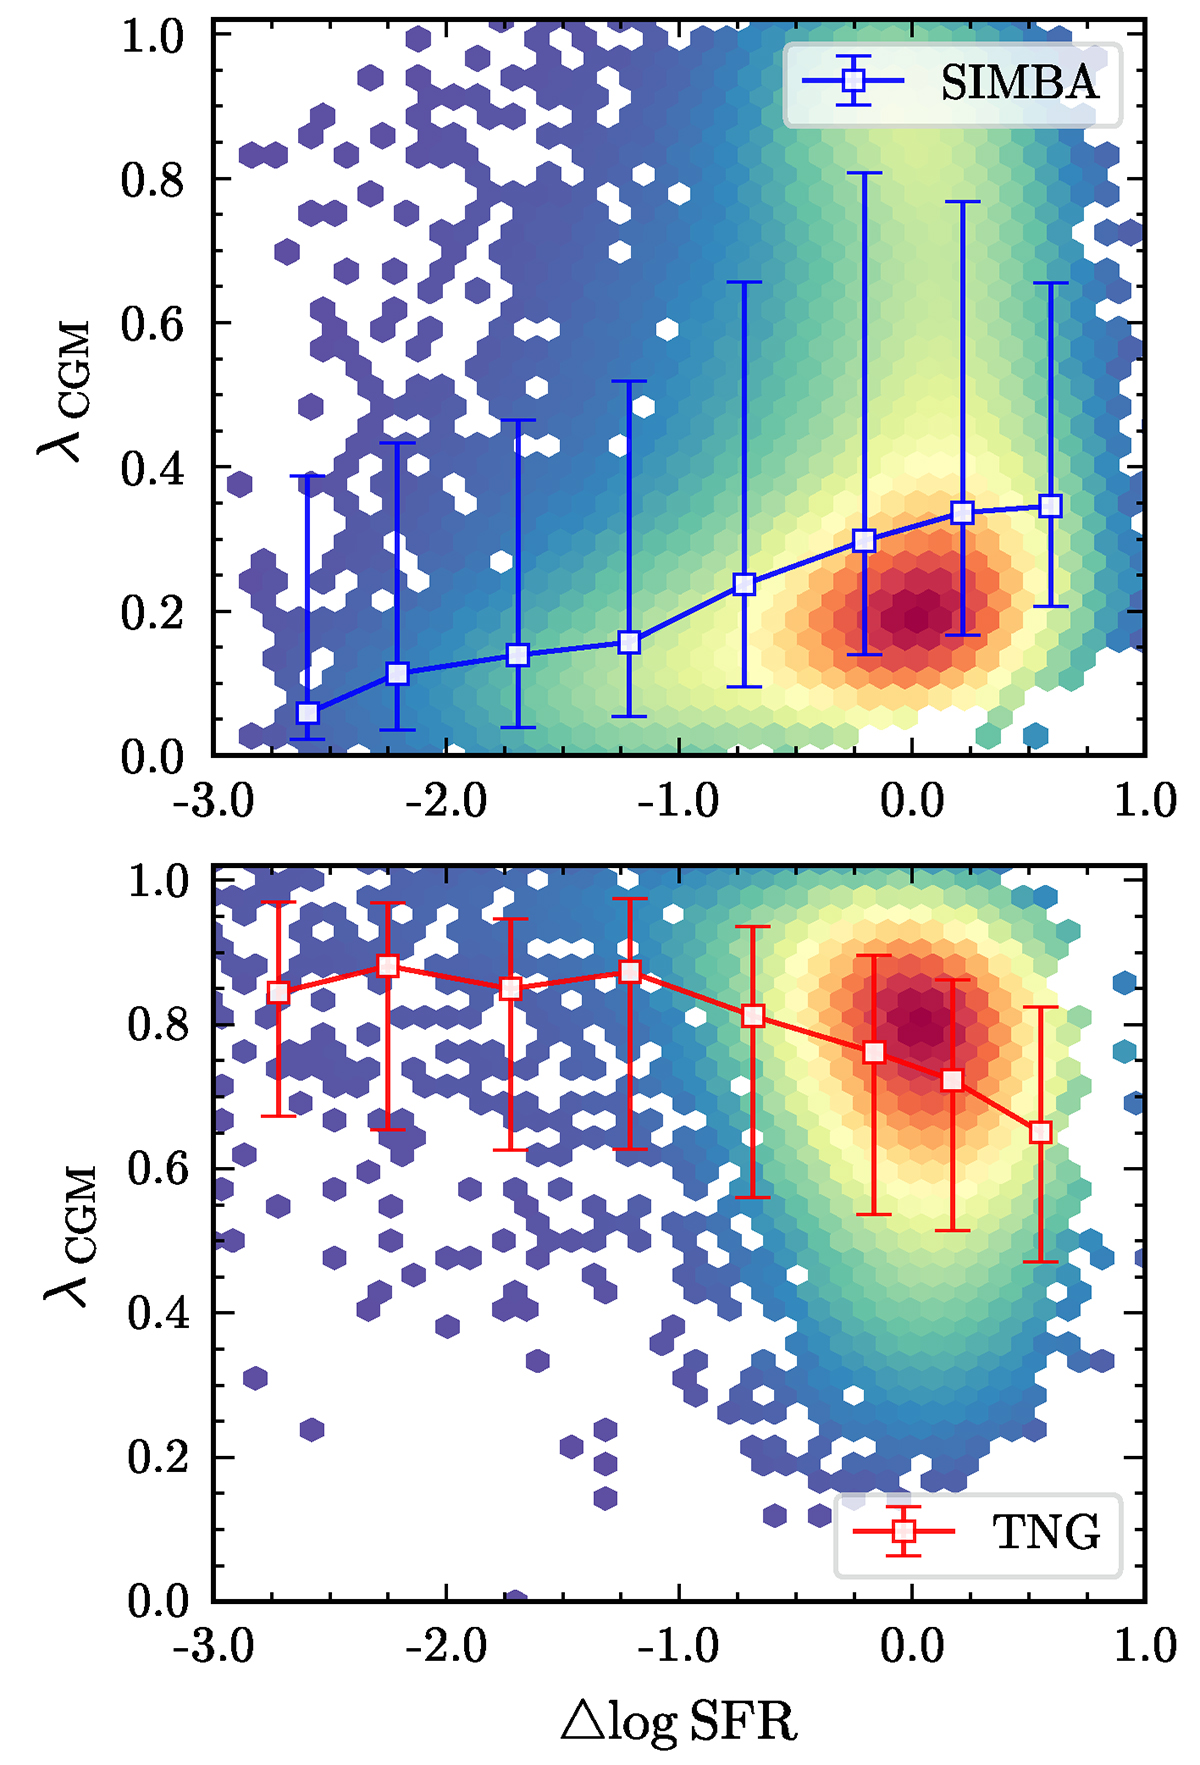
Download original image
Distribution of λCGM as a function of ΔlogSFR in SIMBA (top panel) and TNG (bottom panel). The background is the logarithmic number of galaxies, with colours ranging from light (blue) to dark (red) indicating an increasing number of galaxies. From top to bottom panels, the blue and red lines show the median values and errors estimated from the 16th − 84th percentile ranges for SIMBA and TNG, respectively.
Current usage metrics show cumulative count of Article Views (full-text article views including HTML views, PDF and ePub downloads, according to the available data) and Abstracts Views on Vision4Press platform.
Data correspond to usage on the plateform after 2015. The current usage metrics is available 48-96 hours after online publication and is updated daily on week days.
Initial download of the metrics may take a while.