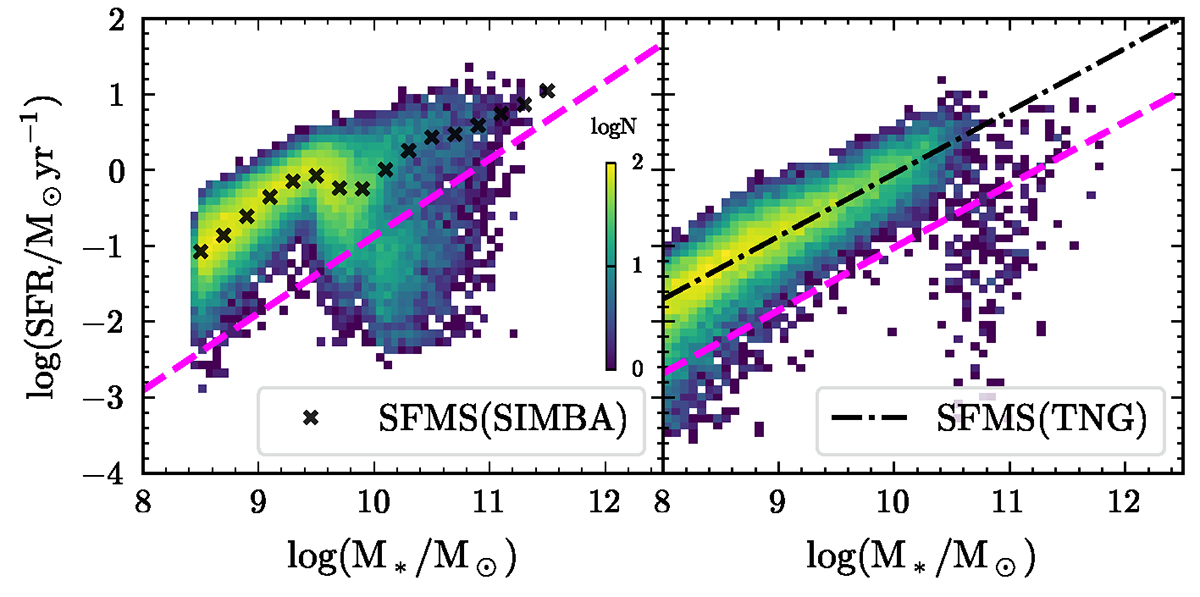
Fig. 1.
Download original image
Distribution of central galaxies at z = 0 as a function of SFR and M*, for SIMBA and TNG in 100 Mpc/h, from left to right, respectively. The coloured background is the logarithmic number of central galaxies. The black dot-dashed line is the SFMS of TNG100, following the definition in Ma et al. (2022): log(SFR/yr−1 M⊙) = 0.83log M* − 8.32, and black cross represents SFMS of star-forming central galaxies in SIMBA100, where star-forming galaxies are simply selected with log(sSFR/Gyr−1 M⊙)≥ − 1.8. Magenta lines separate the star-forming and quenched galaxies in both panels.
Current usage metrics show cumulative count of Article Views (full-text article views including HTML views, PDF and ePub downloads, according to the available data) and Abstracts Views on Vision4Press platform.
Data correspond to usage on the plateform after 2015. The current usage metrics is available 48-96 hours after online publication and is updated daily on week days.
Initial download of the metrics may take a while.